Uptime Kuma is a fancy self-hosted monitoring tool that you can use to monitor websites and applications in real time.
Uptime Kuma Features
- Monitors uptime for HTTP(s) websites, TCP Ports, and Docker containers and retrieves information such as DNS records.
- Sends notifications via Email (SMTP), Telegram, Discord, Microsoft Teams, Slack, Promo SMS, Gotify, and 90+ notification services.
- Supports multiple languages.
- Provides multiple Status Pages.
- Provides Proxy Support.
- Displays SSL certificate information.
- Maps Status Page to Domain.
In this guide, you will learn how to install Uptime Kuma self-hosted monitoring tool and how you can monitor websites using the tool.
For demonstration, we will install the Uptime Kuma Monitoring tool on Ubuntu 20.04. The same instructions also work on RHEL-based distributions and Debian derivatives.
Step 1: Installing Node.JS in Linux
To get started, log into your server and update the local package index.
$ sudo apt update
$ sudo dnf update
Since Uptime Kuma is written in Node.JS, you need to install Node.JS before proceeding any further. We will install the latest LTS release which, at the time of writing this guide, is Node.JS 16.x.
First, add the Nodesource repository to your system. To do so, switch to root user.
$ sudo su
Then add the Nodesource 16.x repository to your system using the following curl command as follows.
$ curl -sL https://deb.nodesource.com/setup_16.x | sudo bash -   [On Debian systems]
$ curl -sL https://rpm.nodesource.com/setup_16.x | sudo bash -   [On RHEL systems]
The command downloads the installation script which updates the package lists adds the Nodesource signing key and creates an apt and dnf list file for the Nodesource 16.x repository.
Once the Nodesource repository has been added, install Node.JS using the package manager as shown.
$ sudo apt install nodejs -y   [On Debian systems]
$ sudo dnf install nodejs -y   [On RHEL systems]
Once installed, confirm the version of NodeJS installed as shown.
$ node --version

V16.17.0
Step 2: Installing Uptime Kuma in Linux
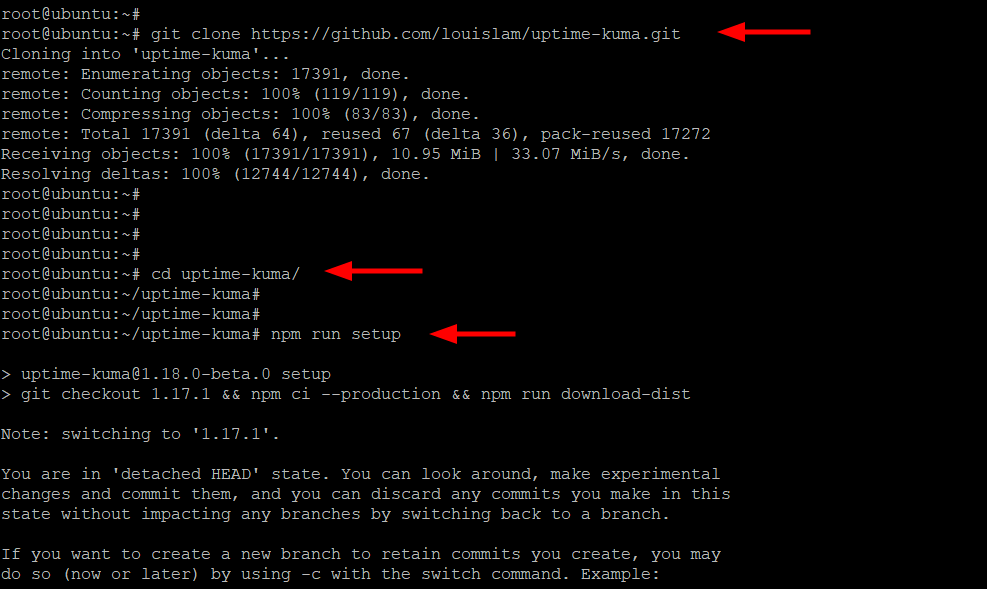
Once Node.JS is installed, you can now proceed to install the Uptime Kuma monitoring tool. First, clone the Uptime Kuma repository from GitHub.
# git clone https://github.com/louislam/uptime-kuma.git
Next, navigate to the Uptime Kuma directory.
# cd uptime-kuma/
Then, set up the monitoring tool using the following command:
# npm run setup
Step 3: Run Uptime Kuma with pm2
PM2 is a production process manager for NodeJS applications that provide a load balancer and helps keeps applications alive indefinitely and reload them without any interruption or service downtime.
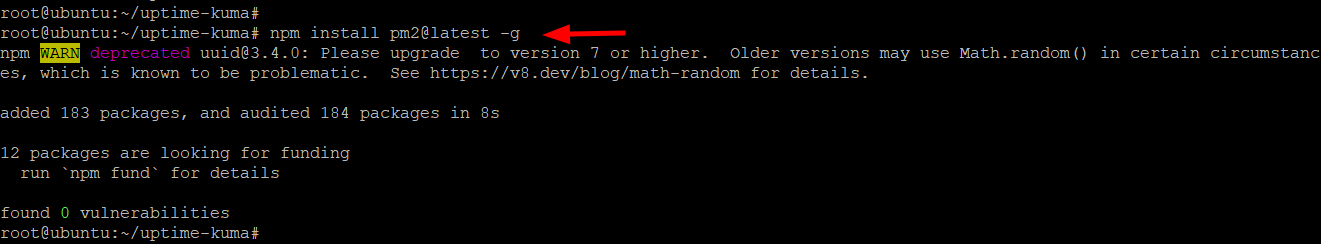
To install the PM2 daemon, run the following command while still in the uptime-kuma directory.
# npm install pm2@latest -g
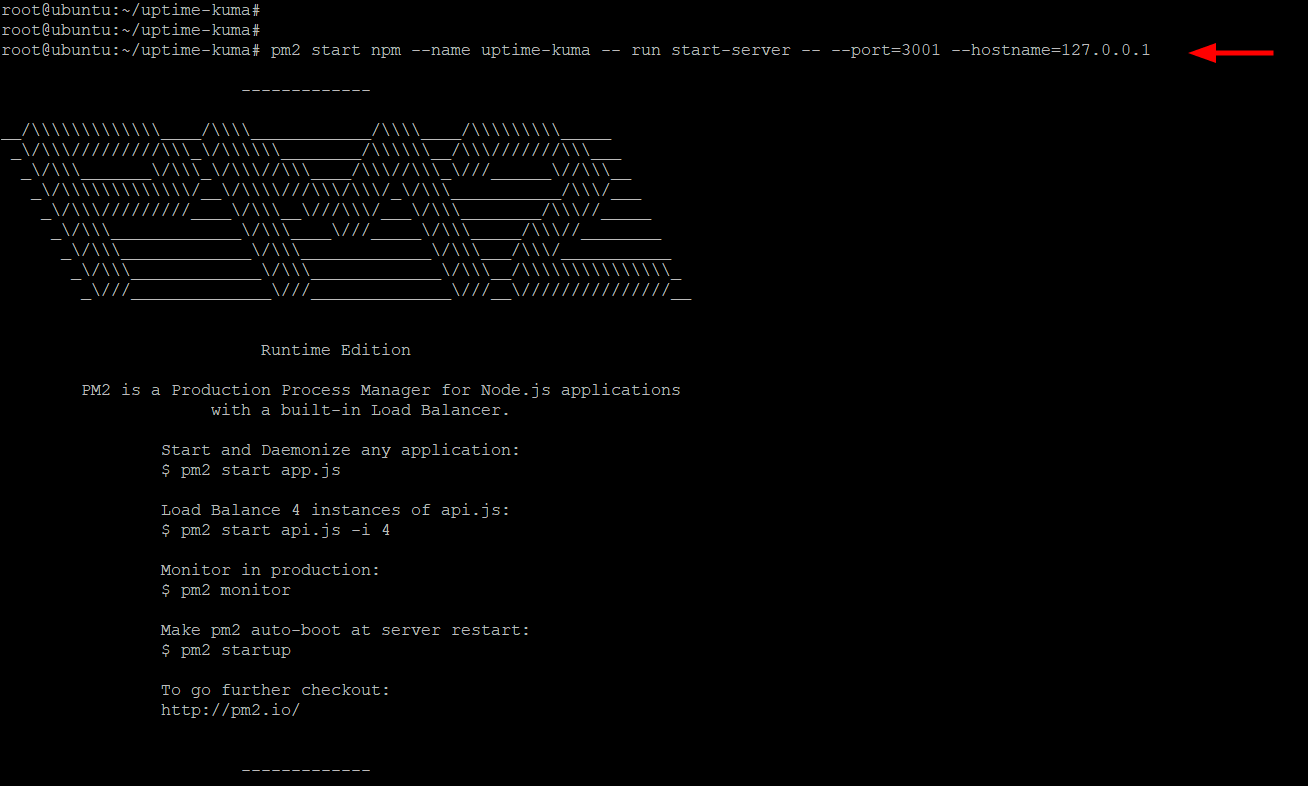
Next, run the pm2 daemon as shown.
# pm2 start npm --name uptime-kuma -- run start-server -- --port=3001 --hostname=127.0.0.1
The command generates the following output.
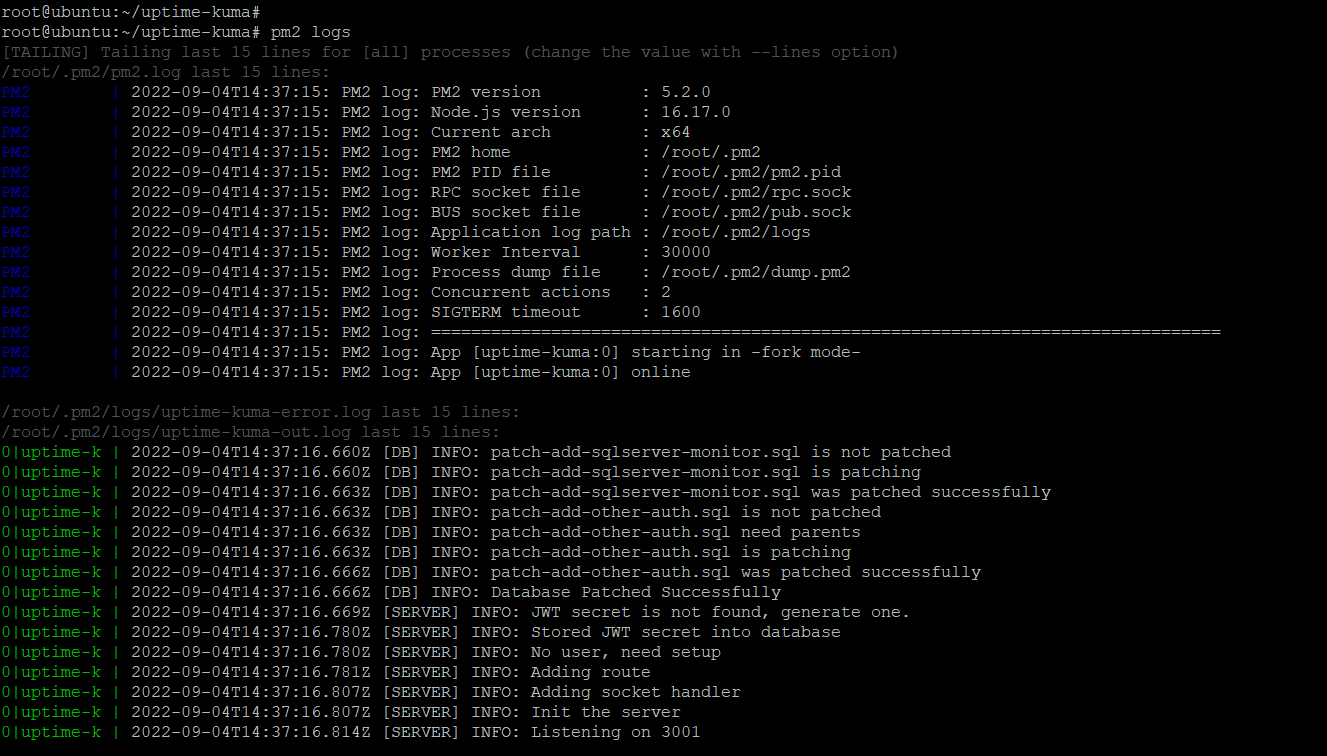
You can view PM2 logs as shown.
# pm2 logs
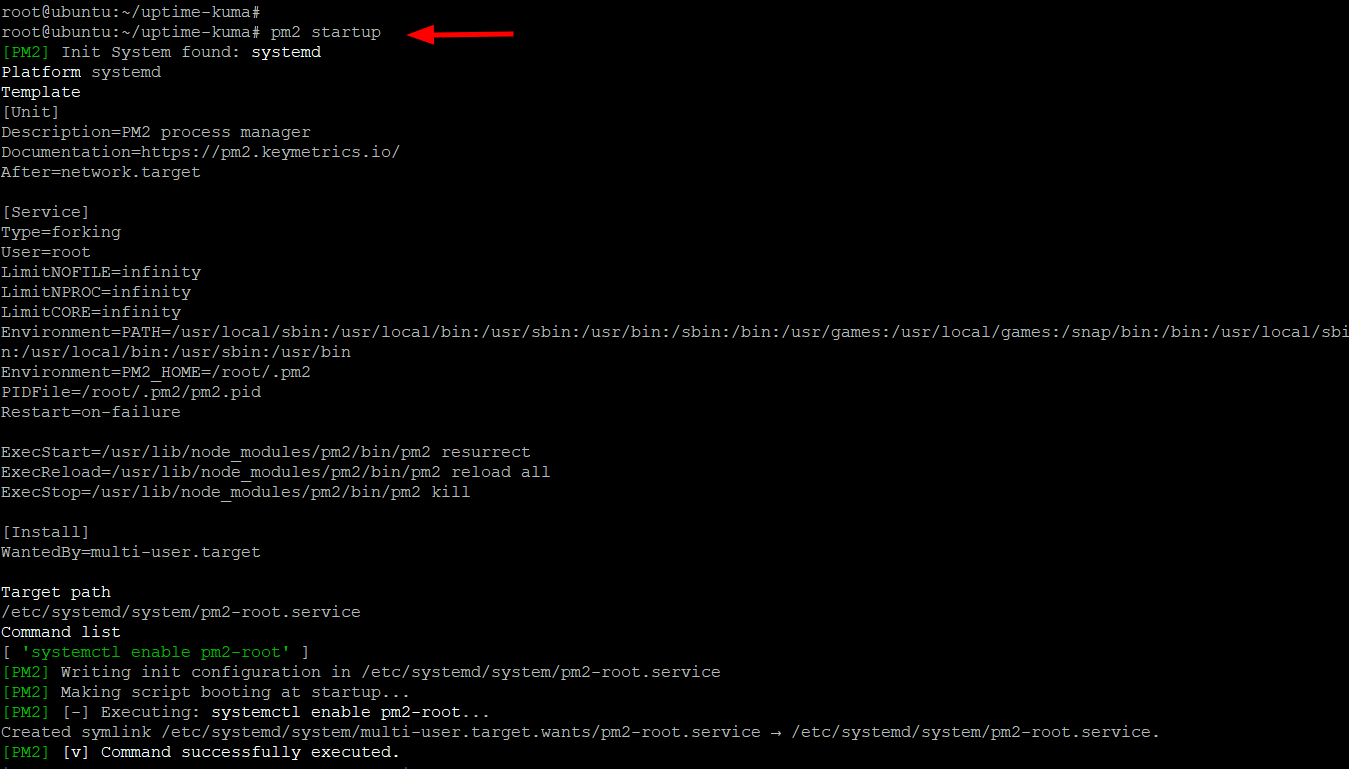
Next, enable the Node.js application to start after a reboot.
# pm2 startup
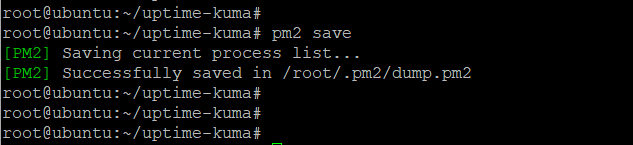
Next, save the application state as shown.
# pm2 save
Step 4: Configure Apache as a Reverse Proxy for Uptime-Kuma
Next, you need to install the Apache web and later configure it to serve as a reverse proxy for Uptime Kuma.
$ sudo apt install apache2 -y   [On Debian systems]
$ sudo dnf install httpd -y     [On RHEL systems]
Once installed, enable the following modules which will be required by the monitoring tool on Debian-based systems.
# a2enmod ssl proxy proxy_ajp proxy_wstunnel proxy_http rewrite deflate headers proxy_balancer proxy_connect proxy_html
Next, create a virtual host file for Uptime Kuma.
$ sudo nano /etc/apache2/sites-available/uptime-kuma.conf   [On Debian systems]
$ sudo vi /etc/httpd/conf.d/uptime-kuma.conf                [On RHEL systems]
Paste the following lines of code. For the ServerName directive, specify your server’s Fully Qualified Doman Name or public IP address.
<VirtualHost *:80>
  ServerName kuma.example.com

  ProxyPass / http://localhost:3001/
  RewriteEngine on
  RewriteCond %{HTTP:Upgrade} websocket [NC]
  RewriteCond %{HTTP:Connection} upgrade [NC]
  RewriteRule ^/?(.*) "ws://localhost:3001/$1" [P,L]
</VirtualHost>
Save the file and exit.
Then activate the Apache virtual host for Uptime Kuma as shown on Debian-based systems.
$ sudo a2ensite uptime-kuma
Then restart the Apache web service for the changes to take effect.
$ sudo systemctl restart apache2   [On Debian systems]
$ sudo systemctl restart httpd     [On RHEL systems]
Step 5: Access Uptime Kuma from the WebUI
With Uptime Kuma installed and fully configured, launch your browser and visit your server’s domain name or public IP address.
http://server-ip
OR
http://domain-name
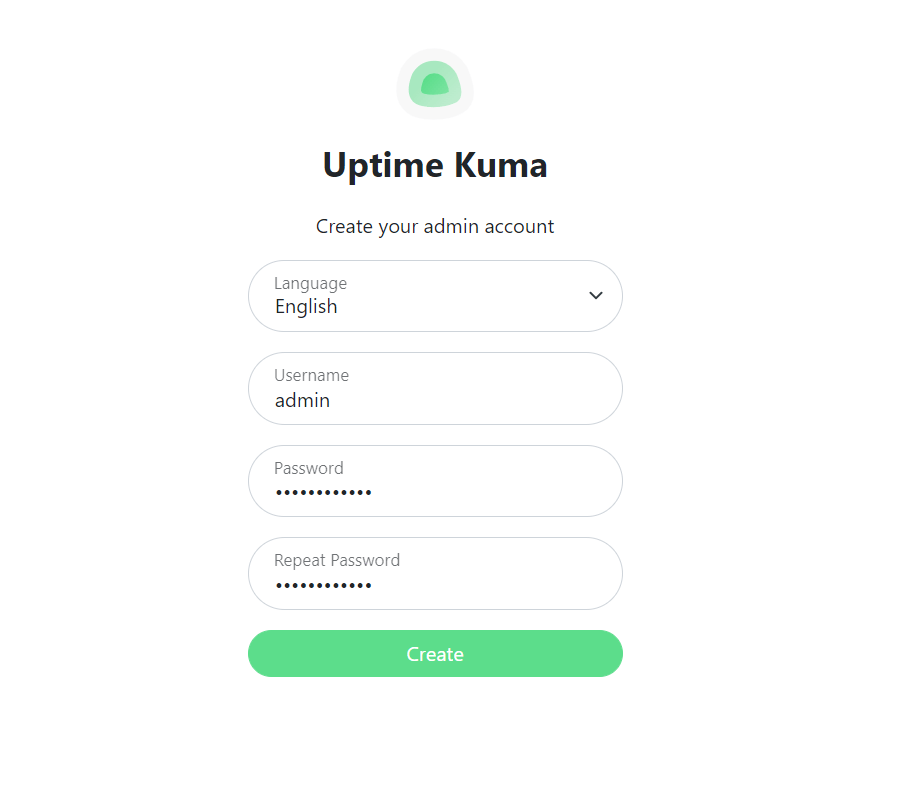
The WebUI will appear as shown and you will be required to create an Admin account. Therefore, provide the username and password and click ‘Create’ to create an Administrator account.
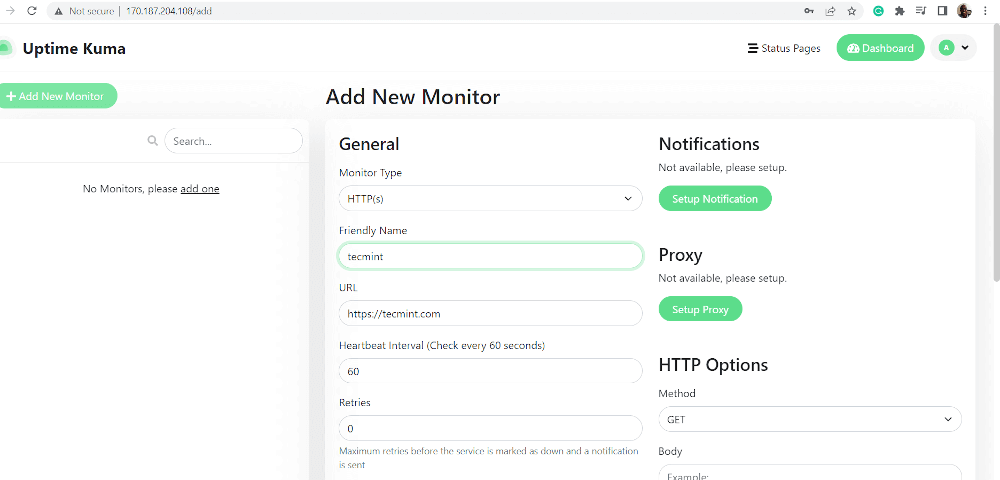
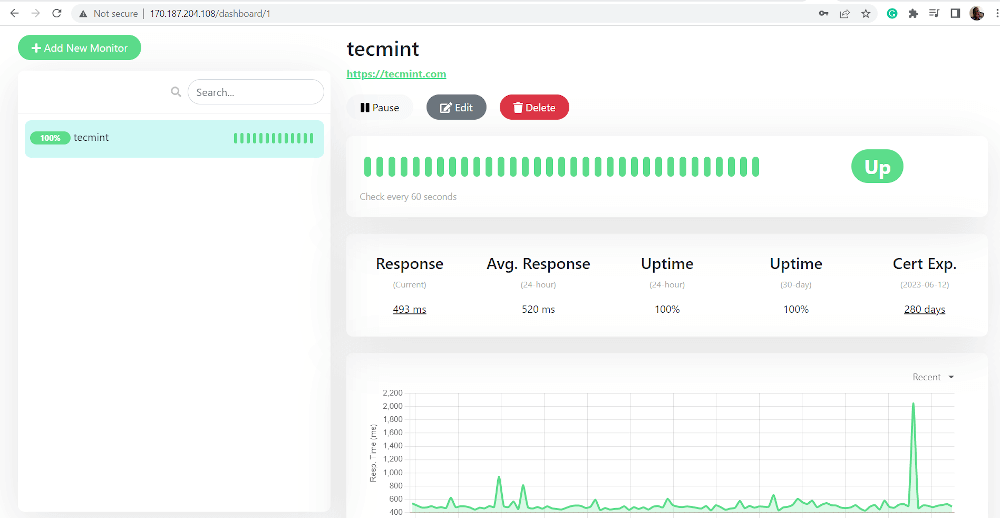
This will log you into Uptime Kuma’s dashboard. To start monitoring a website, click the ‘Add New Monitor’ button. Fill out the details of the site that you want to monitor.
Shortly after, Uptime Kuma will start monitoring your site and provide various uptime metrics as shown.
And that’s it! We have successfully installed and configured Uptime Kuma and managed to monitor a website. Your feedback on this guide is welcome.


It would be great if you can also add a section about How to update kuma.