In this article, you will learn how to monitor Apache web server load and requests using the mod_status module in your Linux distributions such as CentOS, RHEL, and Fedora.
What is mod_status?
mod_status is an Apache module that helps to monitor web server load and current httpd connections with an HTML interface that can be accessed via a web browser.
Apache’s mod_status shows a plain HTML page containing the information about current statistics of the webserver including.
- Total number of incoming requests
- Total number of bytes and counts server
- The CPU usage of Webserver
- Server Load
- Server Uptime
- Total Traffic
- Total number of idle workers
- PIDs with the respective clients and many more.
The default Apache Project enabled their server statistics page to the general public. To have a demo of the busy web site’s status page, visit.
Testing Environment
We have used the following Testing Environment for this article to explore more about mod_status with some practical examples and screen-shots.
- Operating System – CentOS 8/7
- Application – Apache Web Server
- IP Address – 5.175.142.66
- DocumentRoot – /var/www/html
- Apache Configuration file – /etc/httpd/conf/httpd.conf
- Default HTTP Port – 80 TCP
- Test Configuration Settings – httpd -t
The prerequisites for this tutorial are that you should already aware of how to install and configure a Basic Apache Server. If you don’t know how to setup Apache, read the following article that might help you in setting up your own Apache Web Server.
How to Enable mod_status in Apache
The default Apache installation comes with mod_status enabled. If not, make sure to enable it in the Apache configuration file.
[root@tecmint ~]# vi /etc/httpd/conf/httpd.conf
Search for the word “mod_status” or keep scrolling down until you find a line containing.
#LoadModule status_module modules/mod_status.so
If you see a ‘#‘ character at the beginning of “LoadModule”, that means mod_status is disabled. Remove the ‘#‘ to enable mod_status.
LoadModule status_module modules/mod_status.so
Configure mod_status
Now again search for the word “Location” or scroll down until you find a section for mod_status which should look like following.
# Allow server status reports generated by mod_status,
# with the URL of http://servername/server-status
# Change the ".example.com" to match your domain to enable.
#
#<Location /server-status>
#    SetHandler server-status
#    Order deny,allow
#    Deny from all
#    Allow from .example.com
#</Location>
In the above section, uncomment the lines for Location directive, SetHandler, and the directory restrictions according to your needs. For example, I am keeping it simple with the Order Allow, deny and it’s allowed for all.
<Location /server-status>
   SetHandler server-status
   Order allow,deny
   Deny from all
   Allow from all
</Location>
Note: The above configuration is the default configuration for the default Apache web site (single website). If you’ve created one or more Apache Virtual Hosts, the above configuration will won’t work.
So, basically, you need to define the same configuration for each virtual host for any domains you’ve configured in Apache. For example, the virtual host configuration for mod_status will look like this.
<VirtualHost *:80>
    ServerAdmin [email protected]
    DocumentRoot /var/www/html/example.com
    ServerName example.com
    ErrorLog logs/example.com-error_log
    CustomLog logs/example.com-access_log common
<Location /server-status>
   SetHandler server-status
   Order allow,deny
   Deny from all
   Allow from example.com
</Location>
</VirtualHost>
Enable ExtendedStatus
The “ExtendedStatus” settings add more information to the statistics page like CPU usage, request per second, total traffic, etc. To enable it, edit the same httpd.conf file and search for the word “Extended” and Uncomment the line and set the status “On” for ExtendedStatus directive.
# ExtendedStatus controls whether Apache will generate "full" status
# information (ExtendedStatus On) or just basic information (ExtendedStatus
# Off) when the "server-status" handler is called. The default is Off.
#
ExtendedStatus On
Restart Apache
Now make sure that you’ve correctly enabled and configured the Apache server-status page. You can also check for the errors in the httpd.conf configuration using the following command.
[root@tecmint ~]# httpd -t

Syntax OK
Once, you get syntax is OK, you can able to restart the httpd service.
[root@tecmint ~]# service httpd restart
OR
[root@tecmint ~]# systemctl restart httpd
Stopping httpd:                                          [  OK  ]
Starting httpd:                                          [  OK  ]
Access mod_status Page
The Apache status page will be accessible via your domain name with “/server-status” at the following URL’s.
http://serveripaddress/server-status

OR

http://serev-hostname/server-status
You will see something similar to the following page with ExtendedStatus enabled.
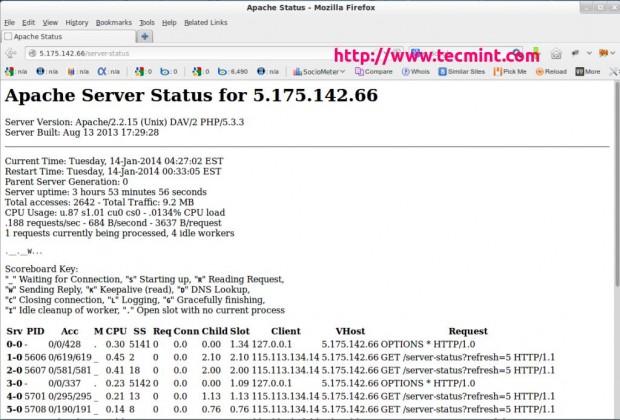
In the above snapshot, you can see that an HTML interface, which shows all information about server uptime, process Id with its respective client, the page they are trying to access.
It also shows the meaning and usage of all the abbreviations used to display the status which helps us to understand the situation better.
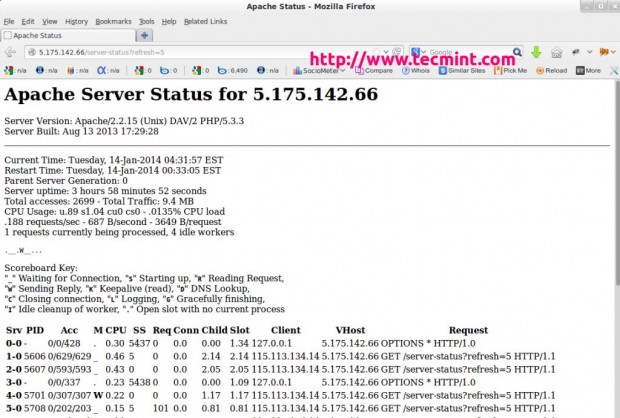
You can also refresh the page every time seconds (say 5 seconds) to see the updated statistics. To set the automated refresh, please add “?refresh=N” at the end of the URL. Where N can be replaced with the number of seconds which you want your page to get refreshed.
http://serveripaddress/server-status/?refresh=5
Command-line Status Page View
You can also view the Apache status page from the command-line interface using the special command-line browsers called links or lynx. You can install them using the default package manager utility called yum as shown below.
# yum install links

OR

# yum install lynx
Once, you’ve installed the, you can get the same statistics on your terminal by using the following command.
[root@tecmint ~]# links http://serveripaddress/server-status
OR
[root@tecmint ~]# lynx http://serveripaddress/server-status
OR
[root@tecmint ~]#  /etc/init.d/httpd fullstatus
Sample Output
                     Apache Server Status for localhost
   Server Version: Apache/2.2.15 (Unix) DAV/2 PHP/5.3.3
   Server Built: Aug 13 2013 17:29:28

   --------------------------------------------------------------------------
   Current Time: Tuesday, 14-Jan-2014 04:34:13 EST
   Restart Time: Tuesday, 14-Jan-2014 00:33:05 EST
   Parent Server Generation: 0
   Server uptime: 4 hours 1 minute 7 seconds
   Total accesses: 2748 - Total Traffic: 9.6 MB
   CPU Usage: u.9 s1.06 cu0 cs0 - .0135% CPU load
   .19 requests/sec - 695 B/second - 3658 B/request
   1 requests currently being processed, 4 idle workers
 .__.__W...

   Scoreboard Key:
   "_" Waiting for Connection, "S" Starting up, "R" Reading Request,
   "W" Sending Reply, "K" Keepalive (read), "D" DNS Lookup,
   "C" Closing connection, "L" Logging, "G" Gracefully finishing,
   "I" Idle cleanup of a worker, "." Open slot with no current process

Srv PID     Acc    M CPU   SS  Req Conn Child Slot     Client        VHost             Request
0-0 -    0/0/428   . 0.30 5572 0   0.0  0.00  1.34 127.0.0.1      5.175.142.66 OPTIONS * HTTP/1.0
                                                                               GET
1-0 5606 0/639/639 _ 0.46 4    0   0.0  2.18  2.18 115.113.134.14 5.175.142.66 /server-status?refresh=5
                                                                               HTTP/1.1
                                                                               GET
2-0 5607 0/603/603 _ 0.43 0    0   0.0  2.09  2.09 115.113.134.14 5.175.142.66 /server-status?refresh=5
                                                                               HTTP/1.1
3-0 -    0/0/337   . 0.23 5573 0   0.0  0.00  1.09 127.0.0.1      5.175.142.66 OPTIONS * HTTP/1.0
                                                                               GET
4-0 5701 0/317/317 _ 0.23 9    0   0.0  1.21  1.21 115.113.134.14 5.175.142.66 /server-status?refresh=5
                                                                               HTTP/1.1
                                                                               GET
5-0 5708 0/212/213 _ 0.15 6    0   0.0  0.85  0.85 115.113.134.14 5.175.142.66 /server-status?refresh=5
                                                                               HTTP/1.1
6-0 5709 0/210/210 W 0.16 0    0   0.0  0.84  0.84 127.0.0.1      5.175.142.66 GET /server-status
                                                                               HTTP/1.1
7-0 -    0/0/1     . 0.00 5574 0   0.0  0.00  0.00 127.0.0.1      5.175.142.66 OPTIONS * HTTP/1.0

   --------------------------------------------------------------------------

    Srv  Child Server number - generation
    PID  OS process ID
    Acc  Number of accesses this connection / this child / this slot
     M   Mode of operation
    CPU  CPU usage, number of seconds
    SS   Seconds since the beginning of the most recent request
    Req  Milliseconds required to process most recent request
   Conn  Kilobytes transferred this connection
   Child Megabytes transferred this child
   Slot  Total megabytes transferred this slot
   --------------------------------------------------------------------------

    Apache/2.2.15 (CentOS) Server at localhost Port 80
Conclusion
Apache’s mod_status module is a very handy monitoring tool for monitoring the performance of a web server’s activity and can able to highlight problems itself. For more information read the status page that can help you to become a more successful web server administrator.
That’s all for mod_status for now, we’ll come up with some more tricks and tips on Apache in future tutorials. Till then stay Geeky and tuned to Tecmint.com and don’t forget to add your valuable comments.