

Innotop is an excellent command-line program, similar to the top command, designed to monitor local and remote MySQL servers running under the InnoDB engine.
It provides a comprehensive set of features and options that help database administrators (DBAs) track various aspects of MySQL performance, troubleshoot issues, and optimize server configurations.
Innotop allows you to monitor critical MySQL metrics such as:
- MySQL replication status
- User statistics
- Query lists
- InnoDB buffers
- InnoDB I/O statistics
- Open tables
- Locked tables
- And more…
The tool refreshes its data regularly, providing real-time insights into the server’s state.
Install Innotop (MySQL Monitoring) Tool in Linux
Innotop is available in most Linux distributions‘ package managers and you can install it using the following commands based on your distribution:
sudo apt install innotop         [On Debian, Ubuntu and Mint]
sudo yum install innotop         [On RHEL/CentOS/Fedora and Rocky/AlmaLinux]
sudo emerge -a sys-apps/innotop  [On Gentoo Linux]
sudo apk add innotop             [On Alpine Linux]
sudo pacman -S innotop           [On Arch Linux]
sudo zypper install innotop      [On OpenSUSE]
sudo pkg install innotop         [On FreeBSD]
If Innotop is not available in your distribution’s package repository, you can clone the GitHub repository and install it manually:
git clone https://github.com/innotop/innotop.git
cd innotop
Next, you need to install some Perl dependencies using CPAN or cpanminus. If you don’t have cpanminus installed, you can install it using your package manager:
sudo apt install cpanminus         [On Debian, Ubuntu and Mint]
sudo yum install cpanminus         [On RHEL/CentOS/Fedora and Rocky/AlmaLinux]
sudo emerge -a sys-apps/cpanminus  [On Gentoo Linux]
sudo apk add cpanminus             [On Alpine Linux]
sudo pacman -S cpanminus           [On Arch Linux]
sudo zypper install cpanminus      [On OpenSUSE]
sudo pkg install cpanminus         [On FreeBSD]
Then, install the required Perl modules using cpanminus.
cpanm Term::ReadKey DBI DBD::mysql
After installing the dependencies, you can run Innotop by executing the following command.
perl innotop
Alternatively, if you’ve installed Innotop via cpanminus, you can start it directly.
innotop
Using Innotop to Monitor MySQL Performance
Once Innotop is running, you can connect to your MySQL server by specifying the username and password with the following command:
innotop -u root -p 'your_password'
Upon connecting to the MySQL server, you will see a dashboard similar to this:

Press ? to view a summary of command-line options and usage.
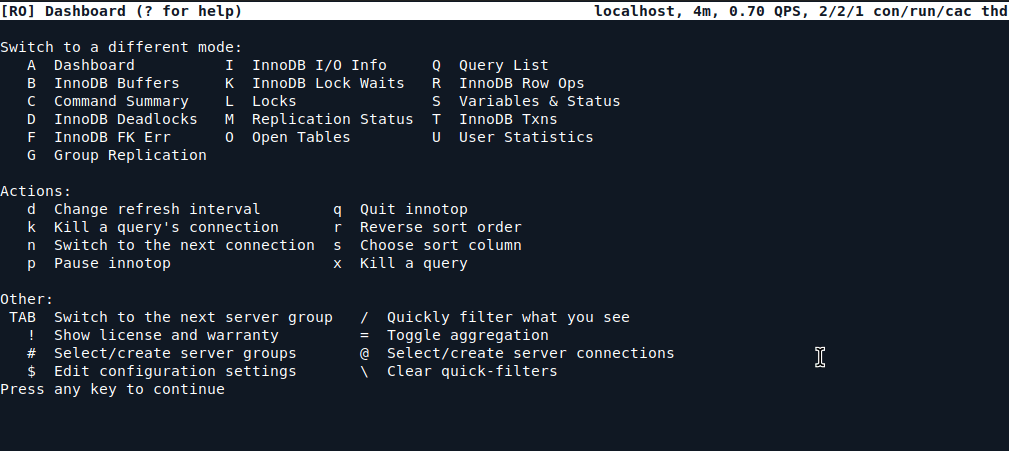
Modes in Innotop
You can switch between different modes by pressing the corresponding keys:
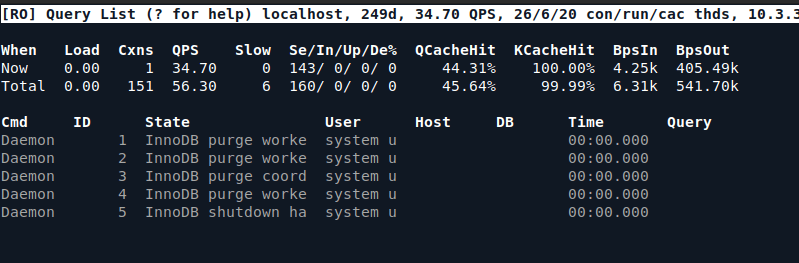
Query List
Displays the output from SHOW FULL PROCESSLIST, similar to the query list mode in mytop. It does not display InnoDB-specific information but is useful for general query monitoring.
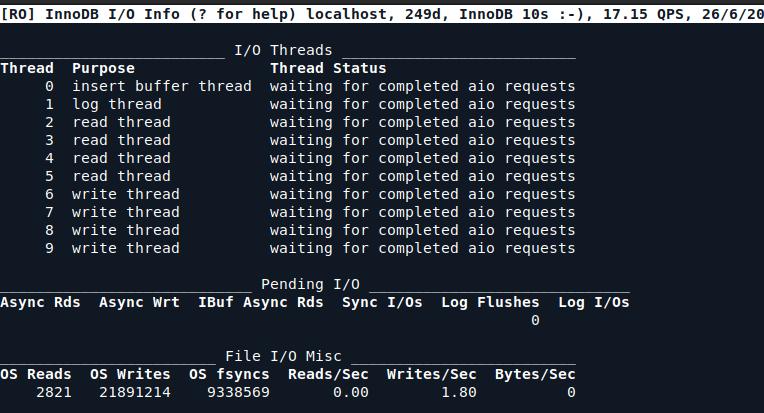
InnoDB I/O Info
Displays InnoDB’s I/O statistics, including pending I/O, I/O threads, file I/O, and log statistics.
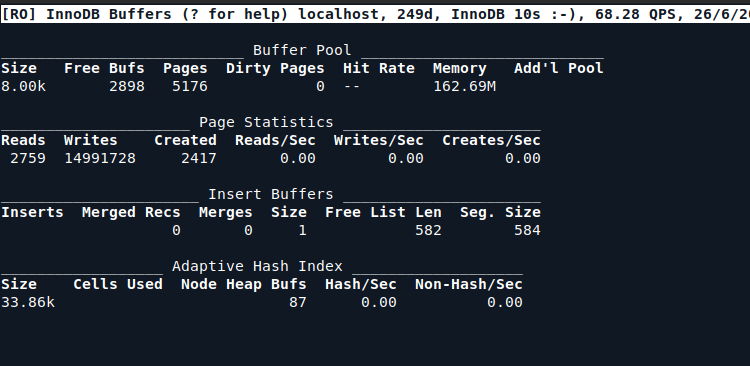
InnoDB Buffers
Displays information about the InnoDB buffer pool, page statistics, insert buffer, and adaptive hash index.
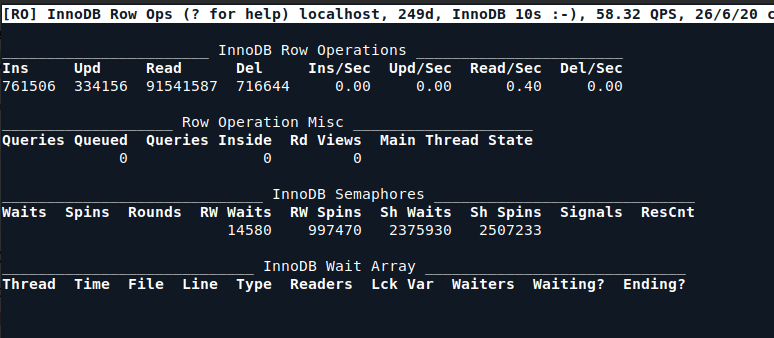
InnoDB Row Operations
Shows InnoDB row operations, including inserts, updates, reads, and deletes.
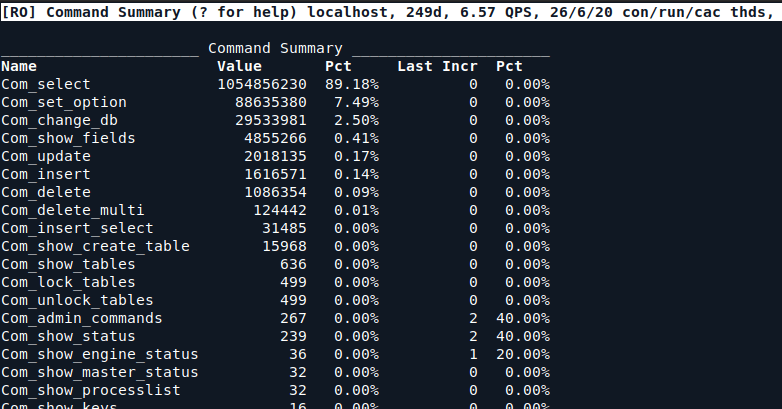
Command Summary
Displays the summary of commands executed on the MySQL server, including the number of times each command has been executed.
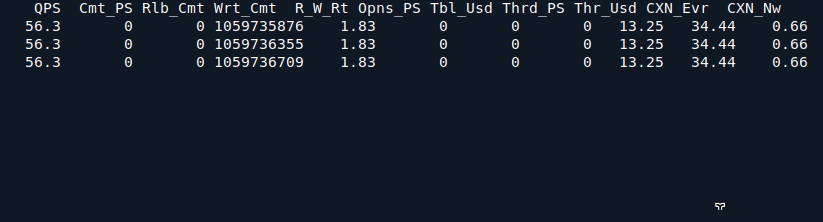
Variables & Status
Displays various server variables and status information, such as queries per second, connections, and cache usage.
Conclusion
Innotop is a powerful tool for MySQL monitoring that provides real-time insights into various aspects of MySQL performance. With its easy-to-use command-line interface, it helps DBAs identify issues, optimize queries, and monitor the health of MySQL servers.
Whether you’re managing a single server or multiple MySQL instances, Innotop offers an efficient way to keep track of performance metrics and ensure smooth database operations.
