Monitorix is an open-source, free, and most powerful lightweight tool designed to monitor system and network resources in Linux. It regularly collects system and network data and displays the information in graphs using its own web interface (which listens on the port 8080/TCP).
Monitorix allows for monitoring overall system performance and also helps in detecting bottlenecks, failures, unwanted long response times, and other abnormal activities.
It contains generally two programs: a collector, called monitorix, which is a Perl daemon that is started automatically like any other system service, and a CGI script called monitorix.cgi.
It is written in Perl language and licensed under the terms of GNU (General Public License) as published by the FSP (Free Software Foundation). It uses RRDtool to generate graphs and display them using the web interface.
This tool is specifically created for monitoring Red Hat-based distributions and Debian-based distributions, but today it runs on many different flavors of GNU/Linux distributions and even it runs on UNIX systems like OpenBSD, NetBSD, and FreeBSD.
The development of Monitorix is currently in an active state and adding new features, new graphs, new updates, and fixing bugs to offer a great tool for Linux system/network administration.
Monitorix Features
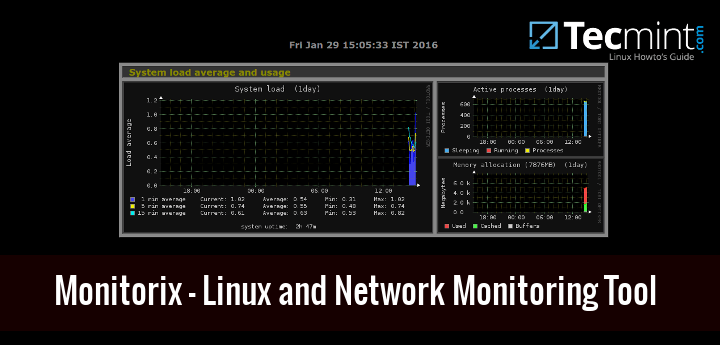
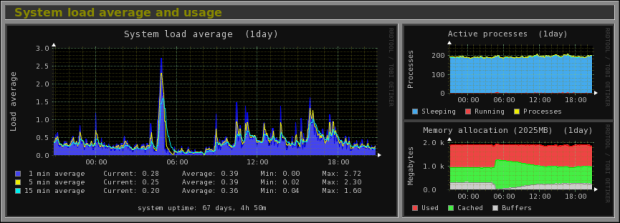
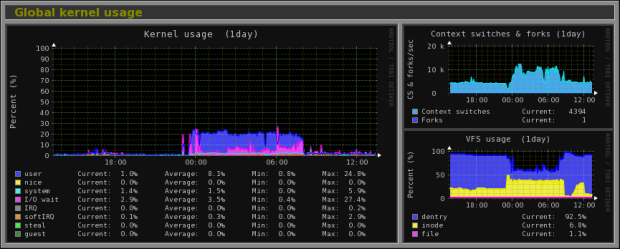
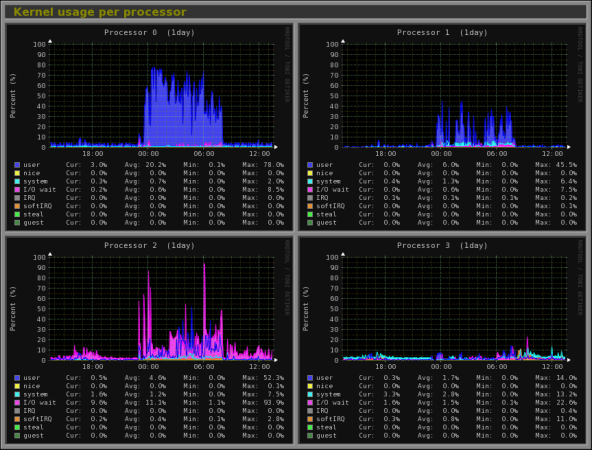
- System load average, active processes, per-processor kernel usage, global kernel usage, and memory allocation.
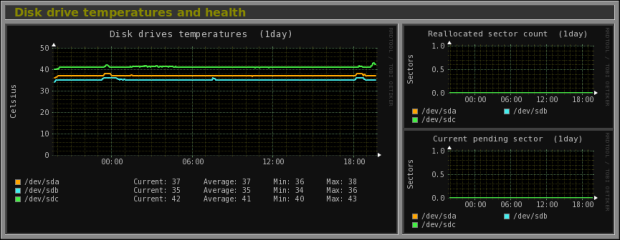
- Monitors Disk drive temperatures and health.
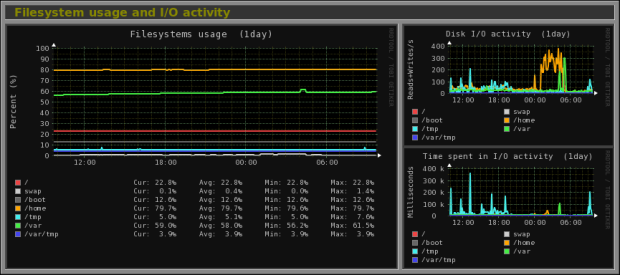
- Filesystem usage and I/O activity of filesystems.
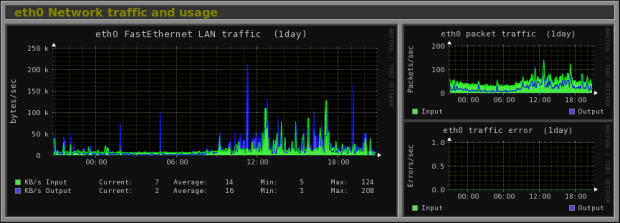
- Network traffic usage up to 10 network devices.
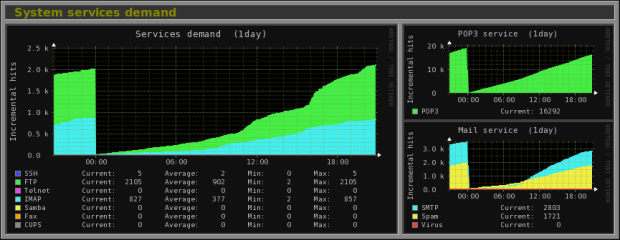
- System services include SSH, FTP, Vsftpd, ProFTP, SMTP, POP3, IMAP, POP3, VirusMail, and Spam.
- MTA Mail statistics including input and output connections.
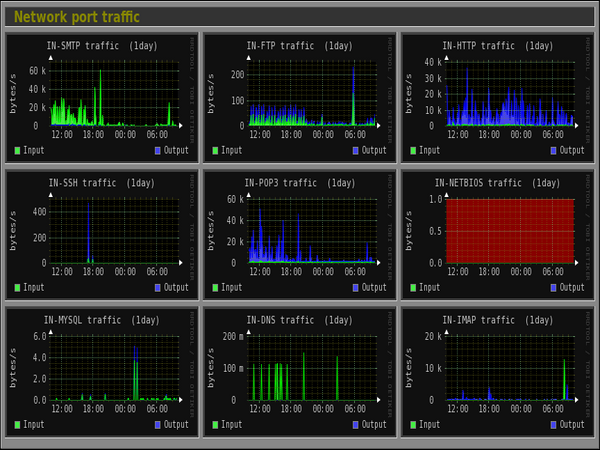
- Network port traffic including TCP, UDP, etc.
- FTP statistics with log file formats of FTP servers.
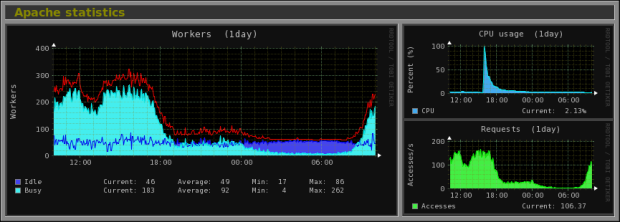
- Apache statistics of local or remote servers.
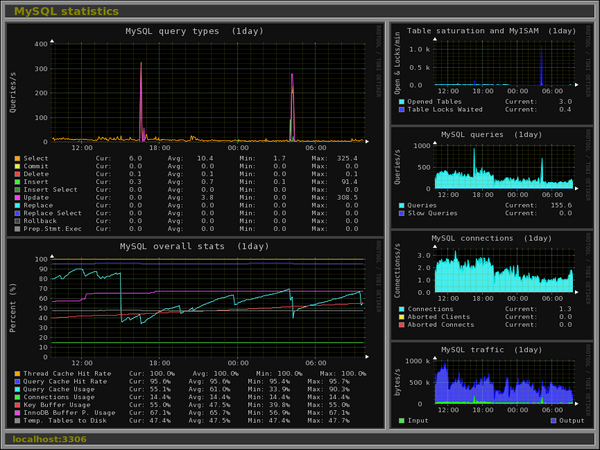
- MySQL statistics of local or remote servers.
- Squid Proxy Web Cache statistics.
- Fail2ban statistics.
- Monitor remote servers (Multihost).
- Ability to view statistics in graphs or in plain text tables per day, week, month, or year.
- Ability to zoom graphs for a better view.
- Ability to define the number of graphs per row.
- Built-in HTTP server.
For a full list of new features and updates, please check out the official feature page.
Installing Monitorix on an RHEL/CentOS/Fedora Linux
To install the most recent version of Monitorix, you need to enable the EPEL repository on the system as shown.
---------- On RHEL 9 Based Systems ----------
# yum install https://dl.fedoraproject.org/pub/epel/epel-release-latest-9.noarch.rpm

---------- On RHEL 8 Based Systems ----------
# yum install https://dl.fedoraproject.org/pub/epel/epel-release-latest-8.noarch.rpm

---------- On RHEL 7 Based Systems ----------
# yum install https://dl.fedoraproject.org/pub/epel/epel-release-latest-7.noarch.rpm
Once EPEL is installed, you can install the following required packages using the yum command.
# yum install rrdtool rrdtool-perl perl-libwww-perl perl-MailTools perl-CGI perl-DBI perl-XML-Simple perl-Config-General perl-IO-Socket-SSL perl-HTTP-Server-Simple wget
Next, install the latest version of the ‘Monitorix‘ package from the EPEL Repository as shown.
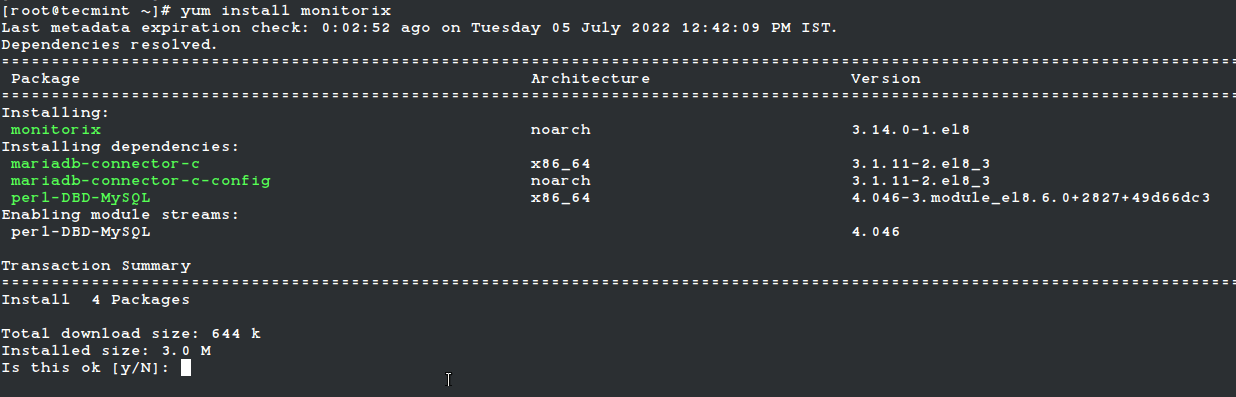
# yum install monitorix
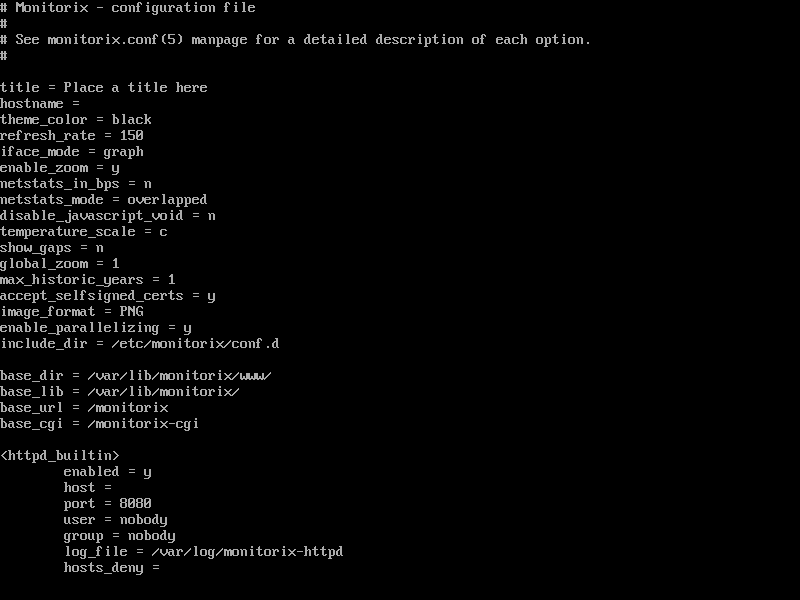
Once successfully installed, please have a look at the main configuration file ‘/etc/monitorix/monitorix.conf‘ to add some extra settings according to your system and enable or disable graphs.
# vi /etc/monitorix/monitorix.conf
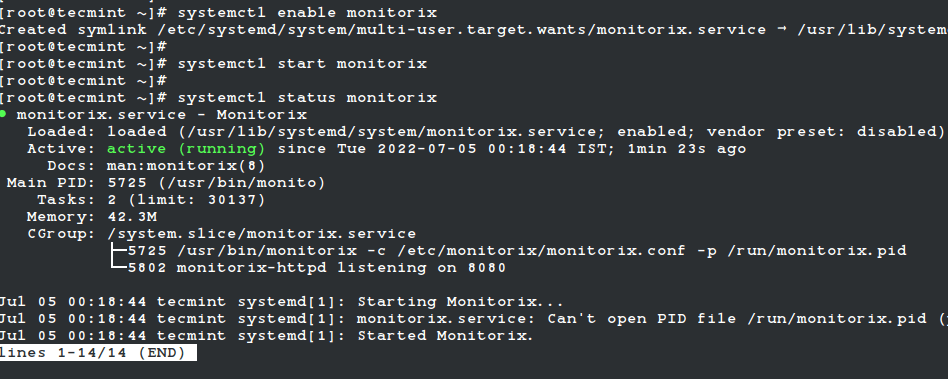
Finally, add Monitorix service to system start-up and start the service with the following commands.
# systemctl enable monitorix
# systemctl start monitorix
# systemctl status monitorix
Once, you’ve started the service, the program will start collecting system information according to the configuration set in the ‘/etc/monitorix/monitorix.conf‘ file, and after a few minutes, you will start seeing the system graphs from your browser at.
http://localhost:8080/monitorix/
OR
http://Server-IP:8080/monitorix/
If you have SELinux in the enabled state, then graphs are not visible and you will get tons of error messages in the ‘/var/log/messages‘ or ‘/var/log/audit/audit.log‘ file about access denied to RRD database files. To get rid of such error messages and visible graphs, you need to disable SELinux.
To Turn Off SELinux, simply change the line “enforcing” to “disabled” in the ‘/etc/selinux/config’ file.
SELINUX=disabled
The above will disable SELinux temporarily until you reboot the machine. If you want the system to start in always disable mode, you need to reboot the system.
Installing Monitorix on a Ubuntu/Debian/Linux Mint
The Monitorix installation on a newer release should be done using the following apt command.
$ sudo apt install monitorix
Users in older releases can use the Izzy repository, which is an experimental repository but the packages from this repository should work on all versions of Ubuntu, Debian, etc.
However, no warranties are given – so the risk is all yours. If you still want to add this repository for automatic updates via apt-get, simply follow the steps provided below for automatic installation.
Add the following line to your ‘/etc/apt/sources.list’ file.
deb http://apt.izzysoft.de/ubuntu generic universe
Get the GPG key for this repository, you can get it using the wget command.
# wget http://apt.izzysoft.de/izzysoft.asc
Once downloaded, add this GPG key to the apt configuration by using the command ‘apt-key‘ as shown below.
# apt-key add izzysoft.asc
Finally, install the package via the repository.
# apt-get update
# apt-get install monitorix
Manual Installation Using .Deb Package
Manually, download the latest version of the .deb package and install it with taking care of required dependencies as shown below.
# apt-get update
# apt-get install rrdtool perl libwww-perl libmailtools-perl libmime-lite-perl librrds-perl libdbi-perl libxml-simple-perl libhttp-server-simple-perl libconfig-general-perl libio-socket-ssl-perl
# wget https://www.monitorix.org/monitorix_3.14.0-izzy1_all.deb
# dpkg -i monitorix_3.14.0-izzy1_all.deb
During installation, a web server configuration takes place. So, you need to reload the Apache web server to reflect the new configuration.
# service apache2 restart         [On SysVinit]
# systemctl restart apache2       [On SystemD]
Monitorix comes with a default configuration, if you wish to change or adjust some settings take a look at the configuration file at ‘/etc/monitorix.conf‘. Once you’ve done the changes reload the service for the new configuration to take effect.
# service monitorix restart         [On SysVinit]
# systemctl restart monitorix       [On SystemD]
Now point your browser to ‘http://localhost:8080/monitorix‘ and start watching graphs of your system. It can be accessed from localhost only if you wish to allow access to remote IPs. Simply open the ‘/etc/apache2/conf.d/monitorix.conf‘ file and add IP’s to the ‘Allow from‘ clause. For example, see below.
<Directory /usr/share/monitorix/cgi-bin/>
        DirectoryIndex monitorix.cgi
        Options ExecCGI
        Order Deny,Allow
        Deny from all
        Allow from 172.16.16.25
</Directory>
After you made changes to the above configuration, do not forget to restart Apache.
# service apache2 restart         [On SysVinit]
# systemctl restart apache2       [On SystemD]
Monitorix Screenshots
Please check out the following screenshots.
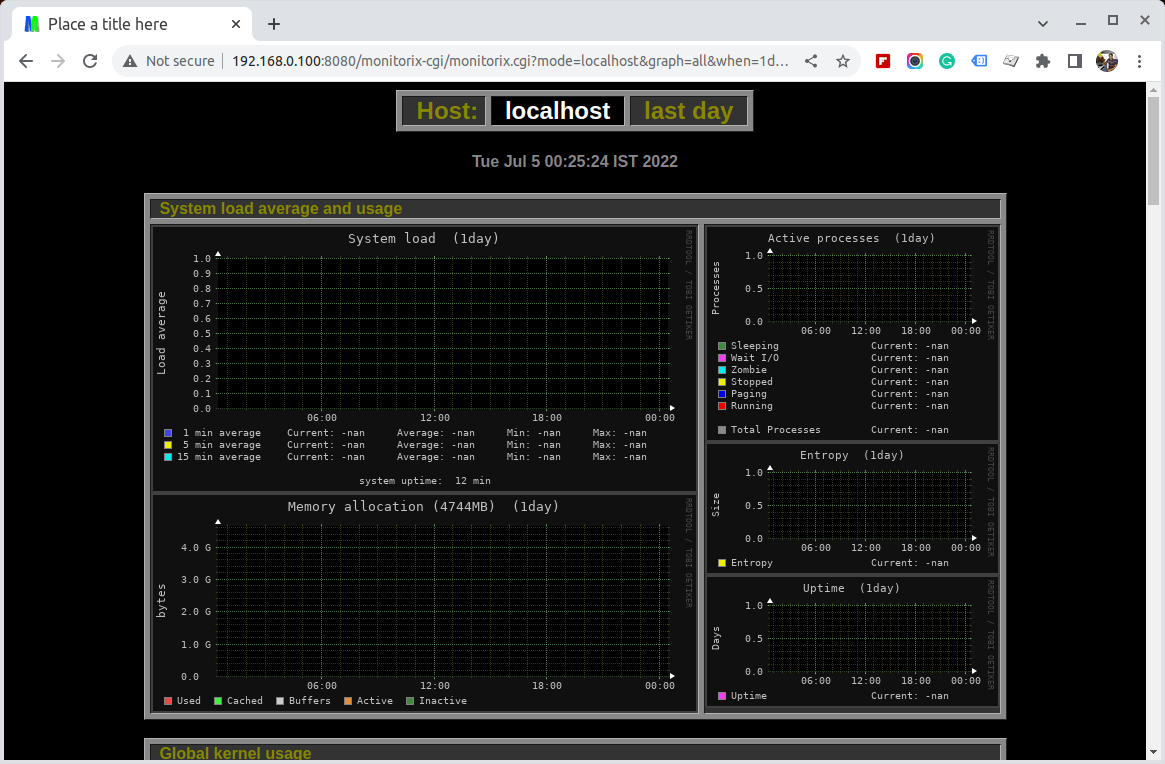
Monitorix Homepage

Monitor Linux Load Average
Monitor Linux Kernel Usage
Monitor Linux Kernel Processor
Monitor Linux Disk Health
Monitor Linux Filesystem and Disk I/O Read
Monitor Linux Network Traffic
Monitor Linux System Services
Monitor Linux Network Port Traffic
Monitor Linux Apache Statistics
Monitor MySQL/MariaDB Statistics


@Tony,
If Tomcat is listening on port 8080 already, monitorix will need to listen on a different port, or shutdown tomcat and then start monitorix so it can listen on port 8080
Connected to Linux via puTTY session and Firefox comes up but say resource not found.
HTTP Status 404 – /monitorix
type Status report
message /monitorix
description The requested resource is not available.
Apache Tomcat/8.0.22
@Tony,
Please check your installation properly, I don’t think Monitorix is installed on your system, if it is installed it should be available at
http://localhost:8080/monitorix/.Also, open port 8080 on the firewall if you running…
Port 8080 is open as I can get to Apache Tomcat from my desktop on that port. How do I verify a good install?
@Tony,
Have you started Monitorix on the server? if not start it:
And also verify that the package monitorix installed on the system using:
Hello everybody,
It is possible that someone is interested in knowing the existence of this Network Monitoring Tool: Pandora FMS Enterprise
Best regards.
NO, it’s proprietary, expensive and has no demo version IT people can train on and see if it is worth it.
Note that if you want to enable password protection (via the built-in webserver) you have to explicitly use the crypt function with htpasswd command, e.g.
without the -d it will use the default algorithm and that fails when authenticating on the browser.
@Anto,
Thanks for sharing the tip, let me try and see how it works….hope it will help others too..
[root@wapp Desktop]# yum install /tmp/monitorix-3.6.0-1.noarch.rpm
Loaded plugins: refresh-packagekit, rhnplugin
This system is not registered with RHN.
RHN support will be disabled.
Setting up Install Process
Examining /tmp/monitorix-3.6.0-1.noarch.rpm: monitorix-3.6.0-1.noarch
Marking /tmp/monitorix-3.6.0-1.noarch.rpm to be installed
Resolving Dependencies
–> Running transaction check
—> Package monitorix.noarch 0:3.6.0-1 set to be updated
–> Processing Dependency: perl(MIME::Lite) for package: monitorix-3.6.0-1.noarch
–> Processing Dependency: perl(RRDs) for package: monitorix-3.6.0-1.noarch
–> Processing Dependency: perl-MIME-Lite for package: monitorix-3.6.0-1.noarch
–> Running transaction check
—> Package monitorix.noarch 0:3.6.0-1 set to be updated
–> Processing Dependency: perl(RRDs) for package: monitorix-3.6.0-1.noarch
—> Package perl-MIME-Lite.noarch 0:3.027-2.el6 set to be updated
–> Processing Dependency: perl(MIME::Types) >= 1.28 for package: perl-MIME-Lite-3.027-2.el6.noarch
–> Running transaction check
—> Package monitorix.noarch 0:3.6.0-1 set to be updated
–> Processing Dependency: perl(RRDs) for package: monitorix-3.6.0-1.noarch
—> Package perl-MIME-Types.noarch 0:1.28-2.el6 set to be updated
–> Finished Dependency Resolution
Error: Package: monitorix-3.6.0-1.noarch (/monitorix-3.6.0-1.noarch)
Requires: perl(RRDs)
You could try using –skip-broken to work around the problem
You could try running: rpm -Va –nofiles –nodigest
[root@wapp Desktop]#
@Koshar,
First install all the required packages as shown in the article and then try again..
Thanks for reply, Actually problem in rrdtool package. After installing correct rpm architecture , its working
@Koshal,
That’s good to hear, finally it worked for you..may I know on which distro you’ve tired latest version of Monitorix? Could you please share the steps with us so that we can update the article to latest version..
Well, we actually used some of the mentioned tools. And we ended up using
CloudView NMS http://www.cloudviewnms.com . We run it on Ubuntu, but it can run on any Linux. Seems like it can monitor/manage practically anything: SNMP, sysLog TL1, services, web access, servers…). They discovered our network put in maps (they use Google maps). Secure multi-user web access with configurable profiles . Alarms forwarding via many protocols (including e-mail) They claim it scalable to thousands of nodes (we have 245 so far) and unlike others they do not charge as your network grows – from my point of view very important feature :-). Remote HTML-5 based interface from anywhere including mobile devices. The only caveat: manual is not that good, but they have very enthusiastic e-mail support. They added some specific feature for us in several days
There are better troubleshooting and configuration options for SELinux than disabling it.
Just installed monitorix and found out that it is exposed to open world!!! Huge security risk here guys. I thougt it was safe and as this turtorial says that one should allow access manually because it is only opened for local host by default, is just bogus. I have tried to close down the access other than from localhost, but it is still open!
Hi
I have installed and configured monitorix . I am able to view http://localhost/monitorix/ page but can’t view graph following error iam getting
(Internal Server Error
The server encountered an internal error or misconfiguration and was unable to complete your request.
Please contact the server administrator, webmaster@localhost and inform them of the time the error occurred, and anything you might have done that may have caused the error.
More information about this error may be available in the server error log. )
Can please help me…..?
disable SELinux and reboot the system and give a try again.
wget http://www.monitorix.org/monitorix-3.2.0-1.noarch.rpm
–2013-08-23 13:09:48– http://www.monitorix.org/monitorix-3.2.0-1.noarch.rpm
Resolving http://www.monitorix.org... 82.98.146.100
Connecting to http://www.monitorix.org|82.98.146.100|:80… connected.
HTTP request sent, awaiting response… 404 Not Found
2013-08-23 13:09:48 ERROR 404: Not Found.
Sorry link was outdated. just updated link with new version. Please download and install it. Thanks.
I prefer Zenoss over Zabbix, more enterprise look and really good support.
Can someone please explain why we’re still publishing how-to articles with SECURITY DISABLING steps in them?! SELinux has been around for a long time, with plenty of documentation. As an industry, taking something that’s designed to make a system more secure and announcing to the world we’re purposefully disabling it rather than taking the time to learn why it’s restricting something seems rather foolish.
Can someone give me a really good reason why I would use this instead of Nagios? ( http://www.nagios.org/ )
Can someone give me a really good reason why i would Nagios over Monitorx?
1. Nagios monitors all your services on the network rather than just the single host that it is on.
2. Nagios has significant amounts of documentation. This book is VERY detailed:
http://shop.oreilly.com/product/9781593270704.do
but you can of course use the website for a lot of docs.
3. Nagios is clever enough to work out whether just a service is down instead of a host, or whether it is likely that a switch is down, rather than the hosts themselves, which helps admins get to the real issue rather than having a lot of warnings that don’t directly tell you the real issue.
4. The way Nagios works means that it is fairly easy to create a ‘plugin’ for it, and as a side effect means that there are already lots of ‘plugins’ available for it.
I say, if you have one or two servers, use Monitorix (easy to set up – took me two minutes), if you have a farm of servers, use Nagios.
I say, if you have a farm of servers, or multiple farms of servers use Zabbix over Nagios. Scales better and is easier to make custom monitoring and triggers, etc. Not that it’s particular hard in Nagios, but it’s even it easier in Zabbix.
@ John
Thanks! I do have a farm of servers/network to manage. I had not heard of Zabbix before and from the 5 minutes spent looking at it, it does appear ‘more polished’ than nagios. I will compare the two in more detail.
With a farm of servers, You should probably checkout http://www.sealion.com. Recently found out about it. Setup is a cake walk, its free and it caters to all system monitoring requirements from top CPU taking processes, memory, disk usage, to network summary, everything I need. Hope you find it useful! :)