Docker is arguably one of the most cherished DevOps tools that streamline the development, deployment, and shipping of applications inside containers.
The concept of containerization entails leveraging container images. These are small, lightweight, and standalone executable packages that include everything that is needed to run an application including the source code, libraries and dependencies, and configuration files.
By doing so, the application can run in almost any computing environment; traditional IT infrastructure, cloud, and a myriad of Linux / UNIX flavors.
Monitoring containers helps operation teams to identify underlying issues and resolve them in a timely fashion. Container monitoring encompasses capturing basic metrics such as CPU usage, memory utilization, container size, and bandwidth utilization to mention a few. Additionally, you can gather real-time logs which are helpful in debugging and alerting the IT team when to scale up.
Zabbix is a popular IT infrastructure monitoring tool that keeps an eye on almost every element of your environment including physical devices such as servers and network devices such as routers and switches. It can also monitor applications, services, and databases.
In this guide, we will show you how you can monitor Docker containers using the Zabbix monitoring tool in Linux.
Requirements
Here is what you need before getting started:
First up, ensure that you have two nodes – The first node is the Zabbix server. This is the node from which we will monitor the remote Docker server. We have an article on:
- How to Install Zabbix on Rocky Linux and AlmaLinux
- How to Install Zabbix Monitoring Tool on Debian 11/10
- How to Install Zabbix on RHEL 8
- How to Install Zabbix on Ubuntu
The second node is the Docker server on which Docker is installed. This is the node from where we will run Docker containers and monitor container activity.
- How to Install Docker on Rocky Linux and AlmaLinux
- How to Install and Use Docker on Ubuntu 20.04
- How to Install Docker in CentOS and RHEL 8/7
Next, ensure that you have SSH access to your Docker server node with a sudo user already configured.
With your setup in place, you can now roll your sleeves!
Step 1: Install Zabbix-Agent in Linux
To monitor Docker containers on the remote server, you need to install a Zabbix agent, which is a monitoring agent that is deployed on a target node to actively monitor system metrics and other applications.
First, you need to install the Zabbix repository on the Docker node.
----------- On Ubuntu 20.04 -----------
$ sudo wget https://repo.zabbix.com/zabbix/5.4/ubuntu/pool/main/z/zabbix-release/zabbix-release_5.4-1+ubuntu20.04_all.deb
$ sudo dpkg -i zabbix-release_5.4-1+ubuntu20.04_all.deb
$ sudo apt update
$ sudo apt install zabbix-agent2

----------- On RHEL-based Distro -----------
$ sudo rpm -Uvh https://repo.zabbix.com/zabbix/5.4/rhel/8/x86_64/zabbix-release-5.4-1.el8.noarch.rpm
$ sudo dnf update
$ sudo dnf install zabbix-agent

----------- On Debian 11 -----------
$ sudo wget https://repo.zabbix.com/zabbix/5.4/debian/pool/main/z/zabbix-release/zabbix-release_5.4-1%2Bdebian11_all.deb
$ sudo dpkg -i zabbix-release_5.4-1%2Bdebian11_all.deb
$ sudo apt update
$ sudo apt install zabbix-agent2

----------- On Debian 10 -----------
$ sudo wget https://repo.zabbix.com/zabbix/5.4/debian/pool/main/z/zabbix-release/zabbix-release_5.4-1%2Bdebian10_all.deb
$ sudo dpkg -i zabbix-release_5.4-1%2Bdebian10_all.deb
$ sudo apt update
$ sudo apt install zabbix-agent2
Step 2: Configure Zabbix-Agent in Linux
By default, the Zabbix agent is set to ship metrics to the Zabbix server on the same host it is installed. Since our objective is to monitor docker containers on the remote server, some additional configurations are required.
Therefore, access the Zabbix agent configuration file.
$ sudo vim /etc/zabbix/zabbix_agent2.conf
The configuration file contains settings that specify the address where the metrics are sent to, the port used for connections and so much more. For the most part, the default settings will work just fine.
To configure the Zabbix agent to send metrics to the Zabbix server, locate the directive which is configured to ship metrics to the loopback address, or simply put, the same host system.
Server=127.0.0.1
Set the address to reflect the Zabbix server’s address
Server=zabbix-server-IP
Additionally, navigate to the ‘Active checks’ section and change the directive to point to the Zabbix server’s IP address.
ServerActive=zabbix-server-IP
Be sure to also adjust the hostname of the Docker server accordingly. The hostname of my Docker server is Ubuntu20.
Hostname=Ubuntu20
Then save the changes and exit the Zabbix configuration file.
For the Zabbix agent to keep an eye on Docker containers, you need to add the Zabbix user, which is installed by default, to the docker group.
$ sudo usermod -aG docker zabbix
To apply the changes made to the configuration file, restart the Zabbix-agent service and enable it to start on system startup.
$ sudo systemctl restart zabbix-agent2
$ sudo systemctl enable zabbix-agent2
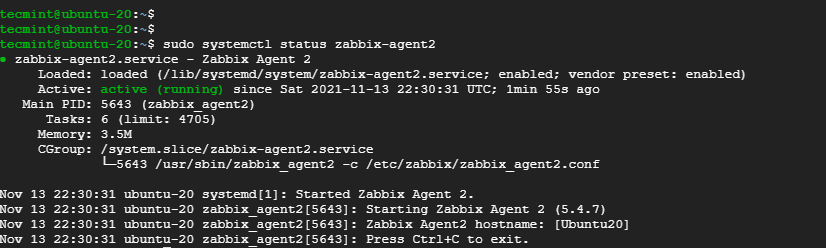
Confirm the running status of the Zabbix agent as follows.
$ sudo systemctl status zabbix-agent2
Zabbix agent listens on port 10050. If you have a UFW firewall or firewalld running, consider opening the port as follows.
----------- On UFW Firewall -----------
$ sudo ufw allow 10050/tcp
$ sudo ufw reload

----------- On Firewalld -----------
$ sudo firewall-cmd --add-port=10050/tcp --permanent
$ sudo firewall-cmd --reload
Great! We are now at the halfway mark. The Zabbix agent can now ship the Docker container metrics to the Zabbix server.
In the next step, we will add the Docker server to the Zabbix web interface and monitor Docker containers.
Step 3: Add the Docker to Zabbix Server for Monitoring
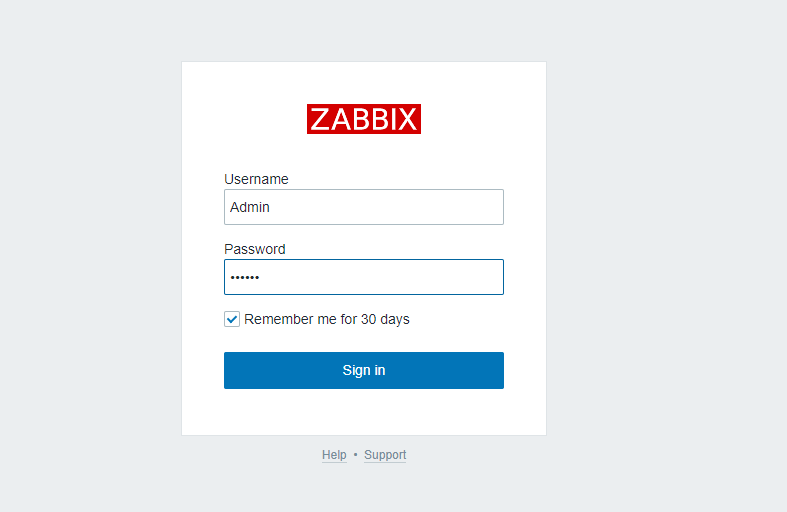
To monitor a remote host, you need to add it to the Zabbix server’s dashboard via a browser. Zabbix provides myriad templates for various services and applications. We will link the appropriate template to the Docker host to specifically monitor containers. But first, access the Zabbix server’s login page.
http://zabbix-server-ip/zabbix
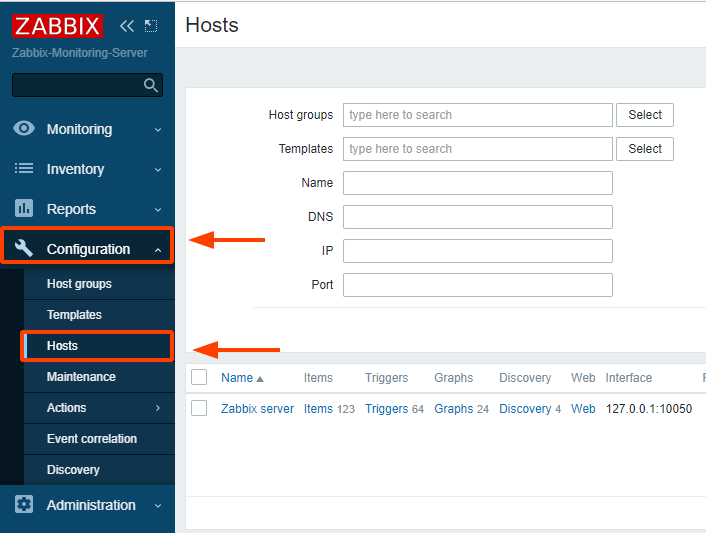
Once you have logged in, navigate to the right sidebar and click on ‘Configuration’ then ‘Hosts’.
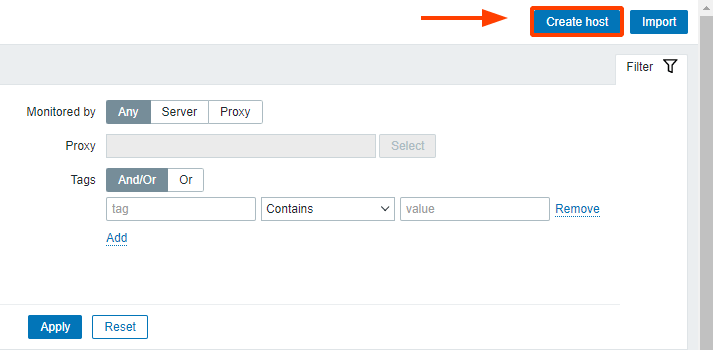
At the far top-right corner, click on ‘Create host’.
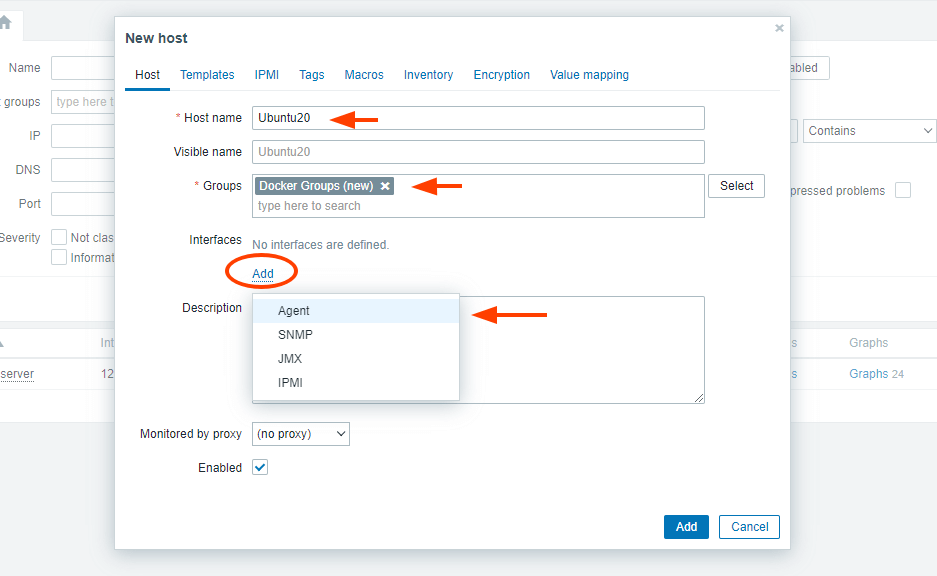
Fill in the details of the Docker server such as the hostname & visible name. For Groups, Type in ‘Docker Groups’ (every host must be associated with a group).
Below the ‘Interfaces’ label click on ‘Add’ and in the menu that appears select ‘Agent’.
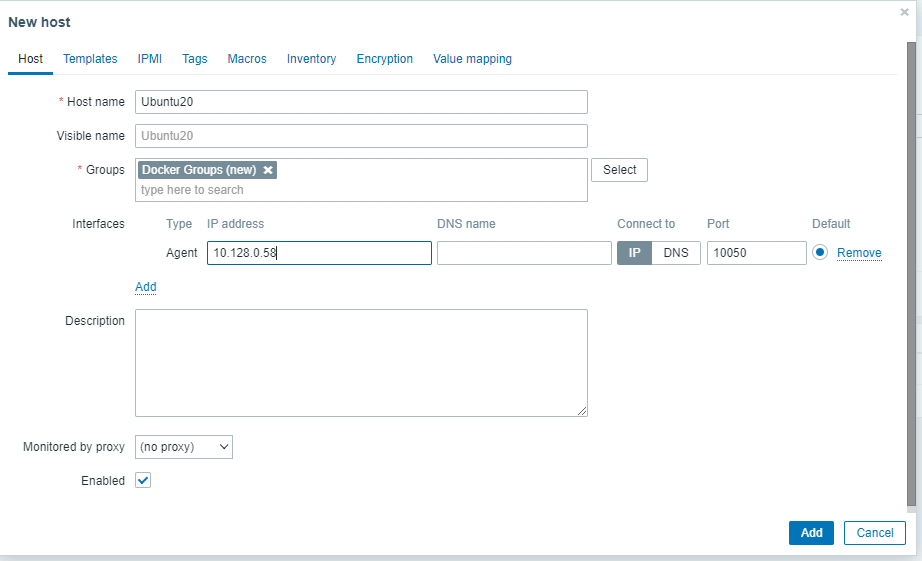
Next, fill out the Docker server’s private IP address and ensure that the port is set to 10050.
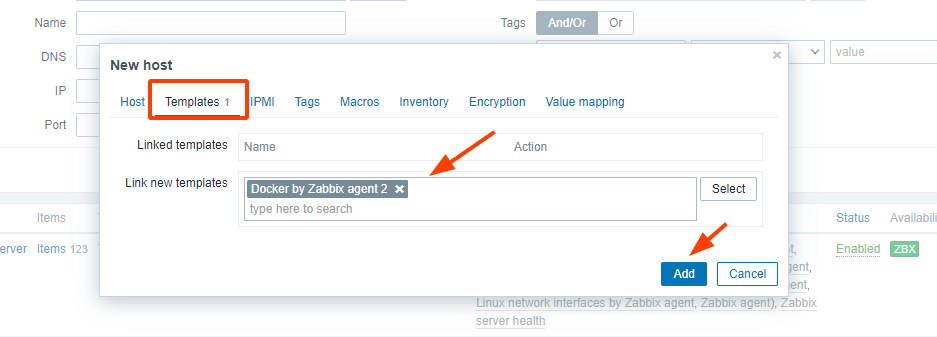
Next, click on the Templates tab, and in the ‘Link new templates’ section, specify ‘Docker by Zabbix agent 2’. Then click the ‘Add’ button.
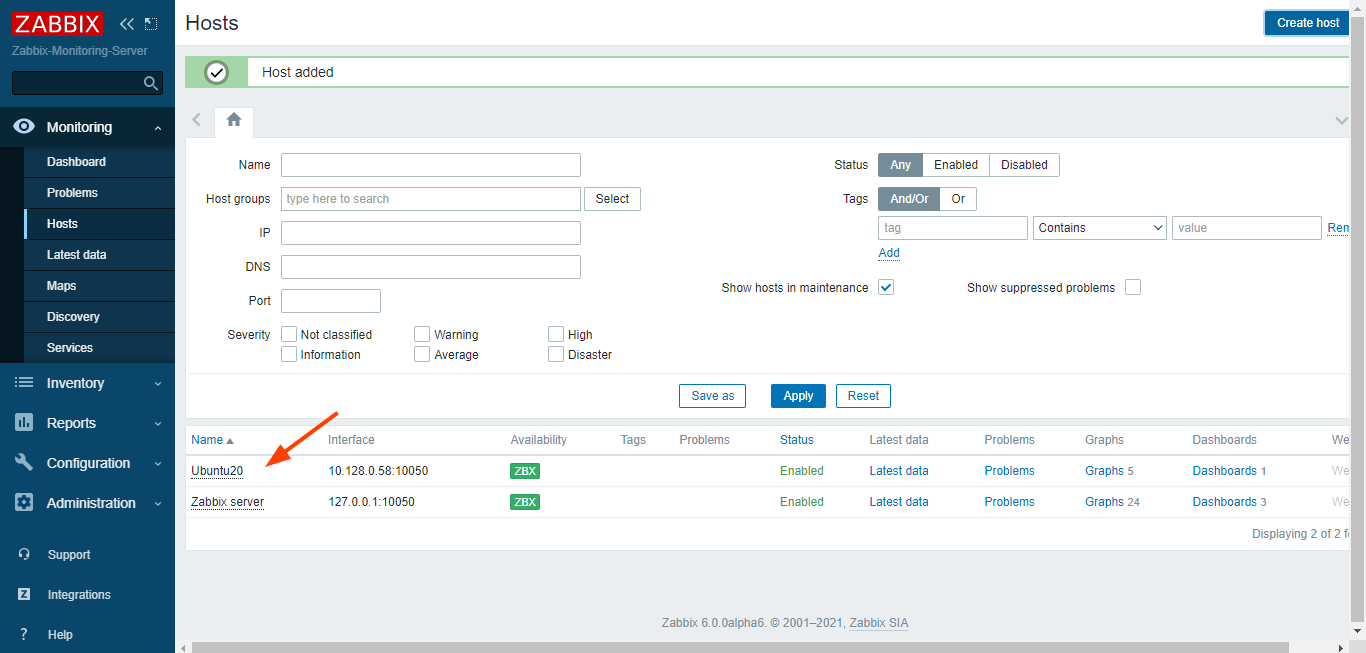
When you click the Add button, the remote Docker host will automatically be added as indicated.
At this point, the Zabbix server is now monitoring your Docker server. In the next step, we will deploy a container and check out which metrics can be monitored.
Step 4: Monitoring Docker Metrics in Zabbix Monitoring
To begin monitoring Docker metrics, we are going to launch a test container. So, head back to your Docker server and launch a container.
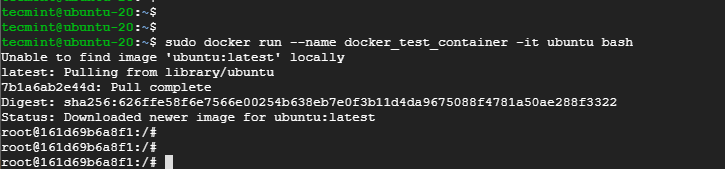
In this example, we will pull a Ubuntu container image and create a container called docker_test_container. We will then gain shell access using the -it option. The entire command for the operations is as follows.
$ sudo docker run --name docker_test_container -it ubuntu bash
You can try something ambitious such as installing software packages such as Apache or MariaDB in order to generate some metrics such as CPU utilization and network traffic.
Now head back to the Zabbix server dashboard. Click on ‘Monitoring’ then ‘Hosts’. Click on the name of your Docker server and in the menu option that appears, select ‘Latest data’.
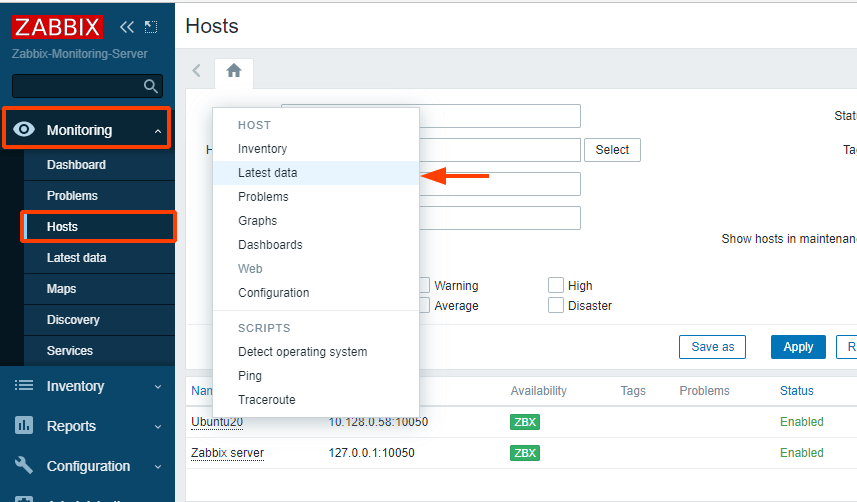
After a few minutes of deploying the container, the Zabbix server will detect the container and start populating some statistics.
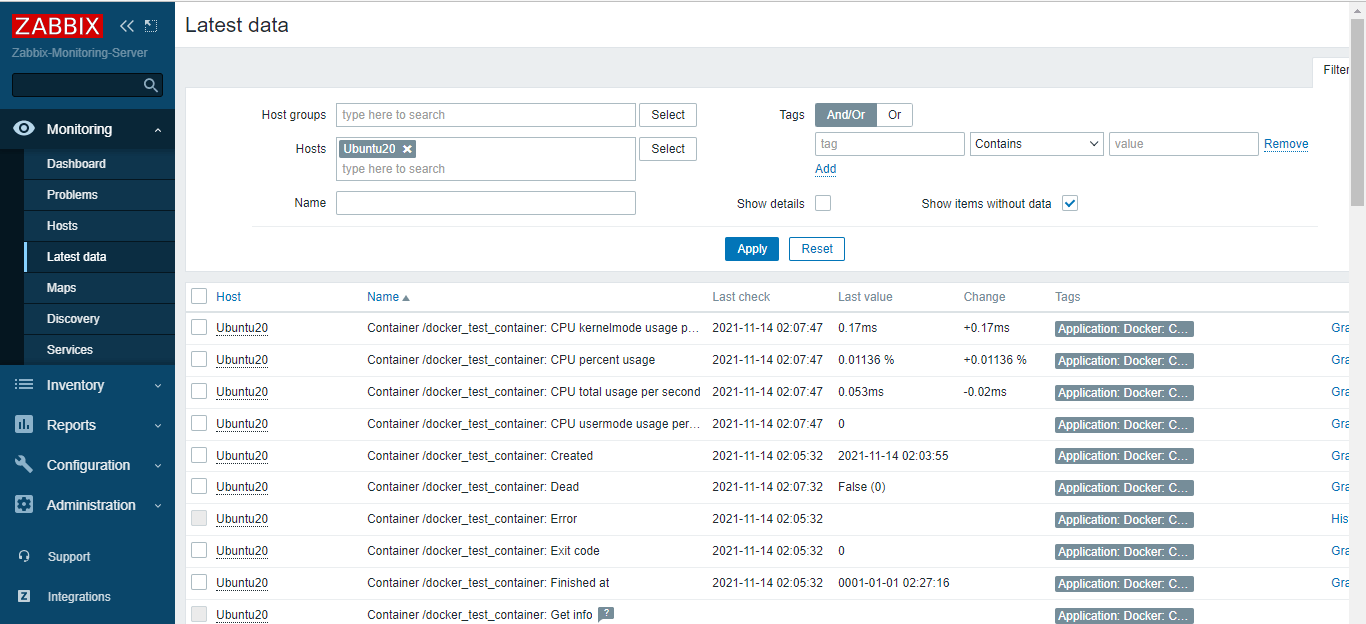
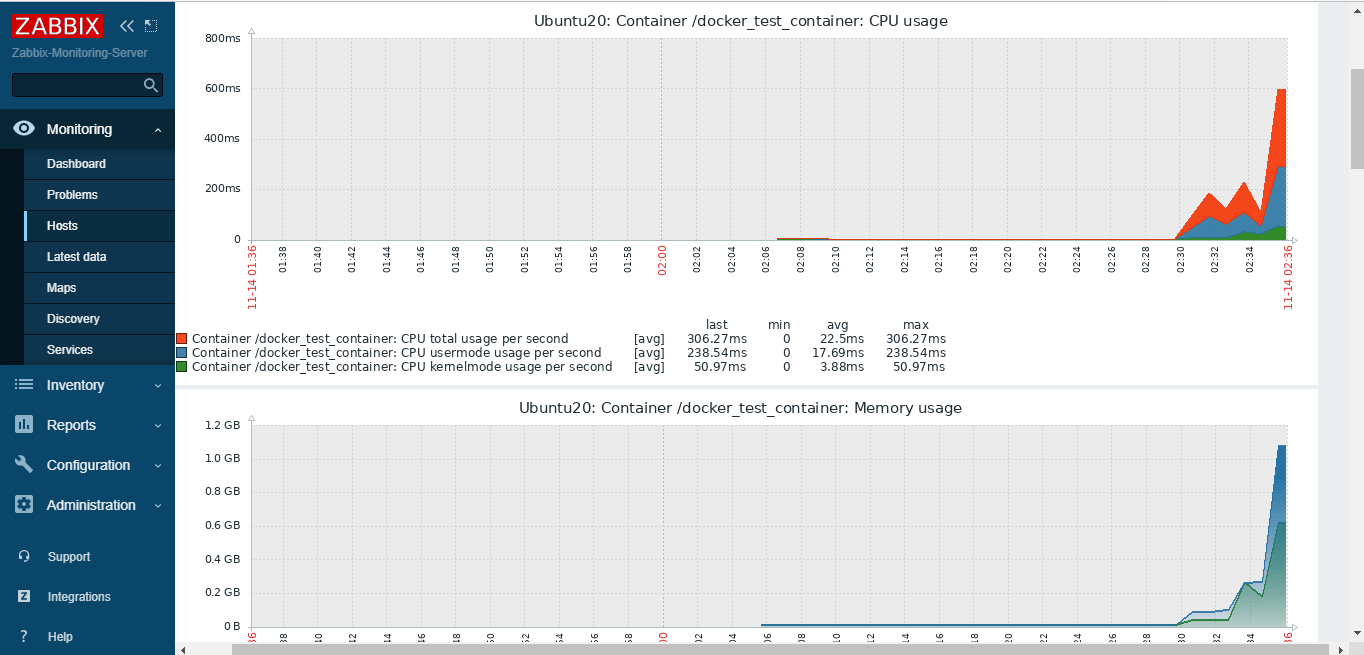
You can also view the graphs of the various container metrics by clicking on the ‘graphs’ options of the Docker server on the ‘Hosts’ page. Below you can see the CPU & Memory usage metrics.
To simulate the container crash, we will unexpectedly exit from the container by running the command below in the container shell.
# exit 2
This implies that we have terminated the container with an error code of 2. This is recorded within the container’s metadata. To view the alert, navigate to the left sidebar and click on ‘Monitoring’ then ‘Dashboard’.
The alert is displayed below.
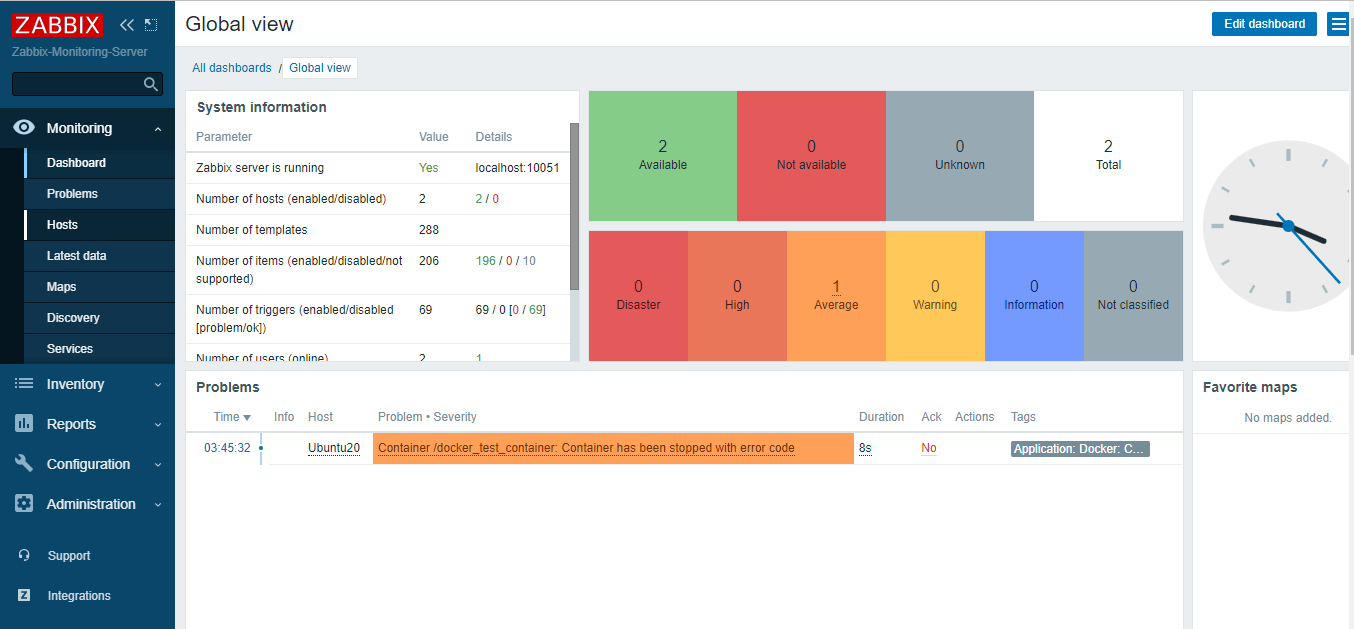
To rectify the error, simply start the container again.
$ sudo docker start docker_test_container
And this brings us to the end of this guide. We have walked you through a step-by-step procedure of how you can Monitor Docker containers using the Zabbix monitoring tool.


