Ever since system administrators have been in charge of managing servers and groups of machines, tools like monitoring applications have been their best friends. You will probably be familiar with tools like Nagios, Zabbix, Icinga, and Centreon. While those are the heavyweights of monitoring, setting them up and fully taking advantage of their features may be somewhat difficult for new users.
In this article we will introduce you to Ganglia, a monitoring system that is easily scalable and allows to view a wide variety of system metrics of Linux servers and clusters (plus graphs) in real time.

Ganglia lets you set up grids (locations) and clusters (groups of servers) for better organization.
Thus, you can create a grid composed of all the machines in a remote environment, and then group those machines into smaller sets based on other criteria.
In addition, Ganglia’s web interface is optimized for mobile devices, and also allows you to export data en .csv and .json formats.
Our test environment will consist of a central CentOS 7 server (IP address 192.168.0.29) where we will install Ganglia, and an Ubuntu 14.04 machine (192.168.0.32), the box that we want to monitor through Ganglia’s web interface.
Throughout this guide we will refer to the CentOS 7 system as the master node, and to the Ubuntu box as the monitored machine.
Installing and Configuring Ganglia
To install the monitoring utilities in the the master node, follow these steps:
1. Enable the EPEL repository and then install Ganglia and related utilities from there:
# yum update && yum install epel-release
# yum install ganglia rrdtool ganglia-gmetad ganglia-gmond ganglia-web
The packages installed in the step above along with ganglia, the application itself, perform the following functions:
rrdtool, the Round-Robin Database, is a tool that’s used to store and display the variation of data over time using graphs.ganglia-gmetadis the daemon that collects monitoring data from the hosts that you want to monitor. In those hosts and in the master node it is also necessary to install ganglia-gmond (the monitoring daemon itself):ganglia-webprovides the web frontend where we will view the historical graphs and data about the monitored systems.
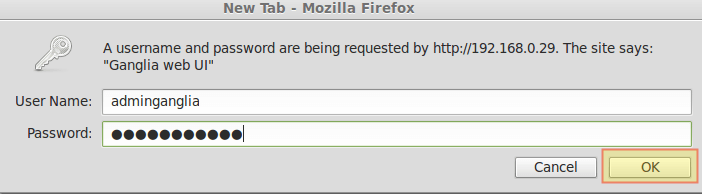
2. Set up authentication for the Ganglia web interface (/usr/share/ganglia). We will use basic authentication as provided by Apache.
If you want to explore more advanced security mechanisms, refer to the Authorization and Authentication section of the Apache docs.
To accomplish this goal, create a username and assign a password to access a resource protected by Apache. In this example, we will create a username called adminganglia and assign a password of our choosing, which will be stored in /etc/httpd/auth.basic (feel free to choose another directory and / or file name – as long as Apache has read permissions on those resources, you will be fine):
# htpasswd -c /etc/httpd/auth.basic adminganglia
Enter the password for adminganglia twice before proceeding.
3. Modify /etc/httpd/conf.d/ganglia.conf as follows:
Alias /ganglia /usr/share/ganglia
<Location /ganglia>
    AuthType basic
    AuthName "Ganglia web UI"
    AuthBasicProvider file
    AuthUserFile "/etc/httpd/auth.basic"
    Require user adminganglia
</Location>
4. Edit /etc/ganglia/gmetad.conf:
First, use the gridname directive followed by a descriptive name for the grid you’re setting up:
gridname "Home office"
Then, use data_source followed by a descriptive name for the cluster (group of servers), a polling interval in seconds and the IP address of the master and monitored nodes:
data_source "Labs" 60 192.168.0.29:8649 # Master node
data_source "Labs" 60 192.168.0.32 # Monitored node
5. Edit /etc/ganglia/gmond.conf.
a) Make sure the cluster block looks as follows:
cluster {
name = "Labs" # The name in the data_source directive in gmetad.conf
owner = "unspecified"
latlong = "unspecified"
url = "unspecified"
}
b) In the udp_send_chanel block, comment out the mcast_join directive:
udp_send_channel   {
  #mcast_join = 239.2.11.71
  host = localhost
  port = 8649
  ttl = 1
}
c) Finally, comment out the mcast_join and bind directives in the udp_recv_channel block:
udp_recv_channel {
  #mcast_join = 239.2.11.71 ## comment out
  port = 8649
  #bind = 239.2.11.71 ## comment out
}
Save the changes and exit.
6. Open port 8649/udp and allow PHP scripts (run via Apache) to connect to the network using the necessary SELinux boolean:
# firewall-cmd --add-port=8649/udp
# firewall-cmd --add-port=8649/udp --permanent
# setsebool -P httpd_can_network_connect 1
7. Restart Apache, gmetad, and gmond. Also, make sure they are enabled to start on boot:
# systemctl restart httpd gmetad gmond
# systemctl enable httpd gmetad httpd
At this point, you should be able to open the Ganglia web interface at http://192.168.0.29/ganglia and login with the credentials from #Step 2.
8. In the Ubuntu host, we will only install ganglia-monitor, the equivalent of ganglia-gmond in CentOS:
$ sudo aptitude update && aptitude install ganglia-monitor
9. Edit the /etc/ganglia/gmond.conf file in the monitored box. This should be identical to the same file in the master node except that the commented out lines in the cluster, udp_send_channel, and udp_recv_channel should be enabled:
cluster {
name = "Labs" # The name in the data_source directive in gmetad.conf
owner = "unspecified"
latlong = "unspecified"
url = "unspecified"
}

udp_send_channel   {
  mcast_join = 239.2.11.71
  host = localhost
  port = 8649
  ttl = 1
}

udp_recv_channel {
  mcast_join = 239.2.11.71 ## comment out
  port = 8649
  bind = 239.2.11.71 ## comment out
}
Then, restart the service:
$ sudo service ganglia-monitor restart
10. Refresh the web interface and you should be able to view the statistics and graphs for both hosts inside the Home office grid / Labs cluster (use the dropdown menu next to to Home office grid to choose a cluster, Labs in our case):

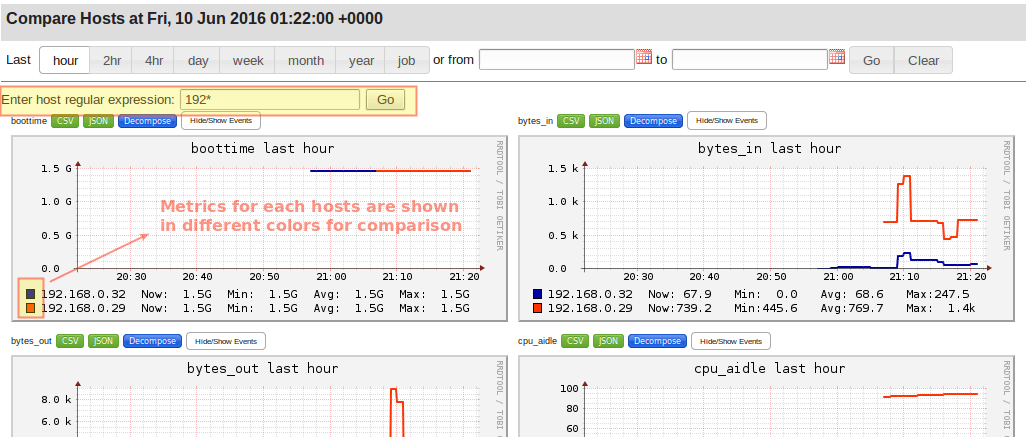
Using the menu tabs (highlighted above) you can access lots of interesting information about each server individually and in groups. You can even compare the stats of all the servers in a cluster side by side using the Compare Hosts tab.
Simply choose a group of servers using a regular expression and you will be able to see a quick comparison of how they are performing:
One of the features I personally find most appealing is the mobile-friendly summary, which you can access using the Mobile tab. Choose the cluster you’re interested in and then the individual host:

Summary
In this article we have introduced Ganglia, a powerful and scalable monitoring solution for grids and clusters of servers. Feel free to install, explore, and play around with Ganglia as much as you like (by the way, you can even try out Ganglia in a demo provided in the project’s official website.
While you’re at it, you will also discover that several well-known companies both in the IT world or not use Ganglia. There are plenty of good reasons for that besides the ones we have shared in this article, with easiness of use and graphs along with stats (it’s nice to put a face to the name, isn’t it?) probably being at the top.
But don’t just take our word for it, try it out yourself and don’t hesitate to drop us a line using the comment form below if you have any questions.


Do you have a process for Lustre file system creation?
I am getting this error “There was an error collecting ganglia data (127.0.0.1:8652): fsockopen error: Permission denied”
Hello, I followed all of your steps but when I try to use the IP address/ganglia I get a message that “The requested URL /ganglia was not found on this server.” Any way of knowing as to why this occurred.
Here: http://bit.ly/2qrHcwg (This is actually a Google books link but I had to shorten it).
Hope it helps.