Are you having problems monitoring your Linux network bandwidth usage? Do you need help? It’s important that you are able to visualize what is happening in your network in order to understand and resolve whatever is causing network slowness or simply to keep an eye on your network.
In this article, we will review 19 useful bandwidth monitoring tools to analyze network usage on a Linux system. The tools listed below are all open source and can help you to answer questions such as “why is the network so slow today?”.
This article includes a mix of small tools for monitoring bandwidth on a single Linux machine and complete monitoring solutions capable of handling a few numbers of hosts on a LAN (Local Area Network) to multiple hosts even on a WAN (Wide Area Network).
If you are looking for monitoring and networking tools to manage, troubleshoot or debug your Network, then read our following articles:
Let’s get started…
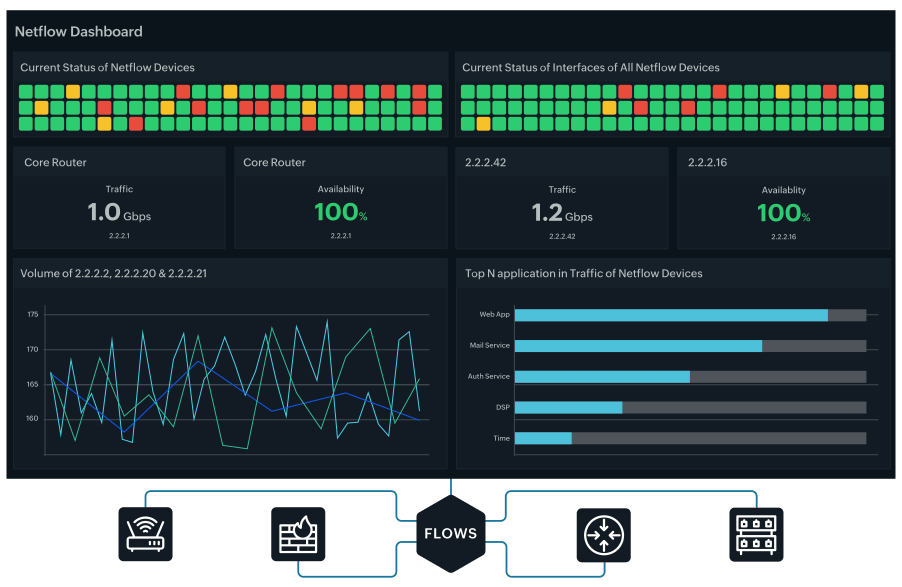
1. Site24x7’s NetFlow Analyzer – Network Traffic Monitoring
Site24x7’s NetFlow Analyzer is a cloud-based network traffic and bandwidth monitoring tool that monitors your source and destination devices, their interfaces, and the traffic that flows through them.
Configure threshold values for all key metrics, such as inbound traffic, outbound traffic, and bandwidth usage, and receive instant alerts when a threshold is exceeded.
NetFlow Analyzer analyzes flow based on different technologies, like NetFlow, sFlow, and J-Flow. You can obtain complete visibility into the network bandwidth with stats on the peak traffic, top applications, and top conversations.
Identify bandwidth hogs, fix them, and boost your network performance using Site24x7’s network bandwidth monitoring tool.
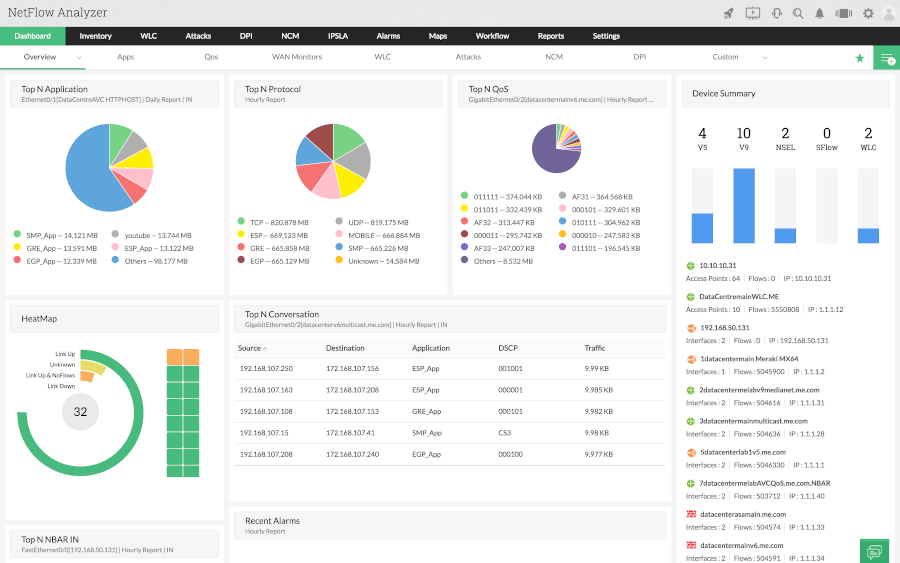
2. ManageEngine Netflow Analyzer
ManageEngine NetFlow Analyzer is a flow-based bandwidth monitoring solution that offers multi-vendor support. It monitors your network, analyzes traffic patterns, and detects and diagnoses bandwidth hogs.
You can track the traffic patterns in your network over any period of time, and drill down further into the device, interface, application, and user-level details.
With its traffic shaping abilities, NetFlow Analyzer helps you identify network anomalies in real-time and troubleshoot them before they affect your end-users.
With its customizable reports, NetFlow Analyzer also helps you predict and plan your bandwidth requirements. You can create, schedule, and generate comprehensive bandwidth analysis reports in just a few clicks.
3. vnStat – A Network Traffic Monitor
VnStat is a fully-featured, command line-based program to monitor Linux network traffic and bandwidth utilization in real-time, on Linux and BSD systems.
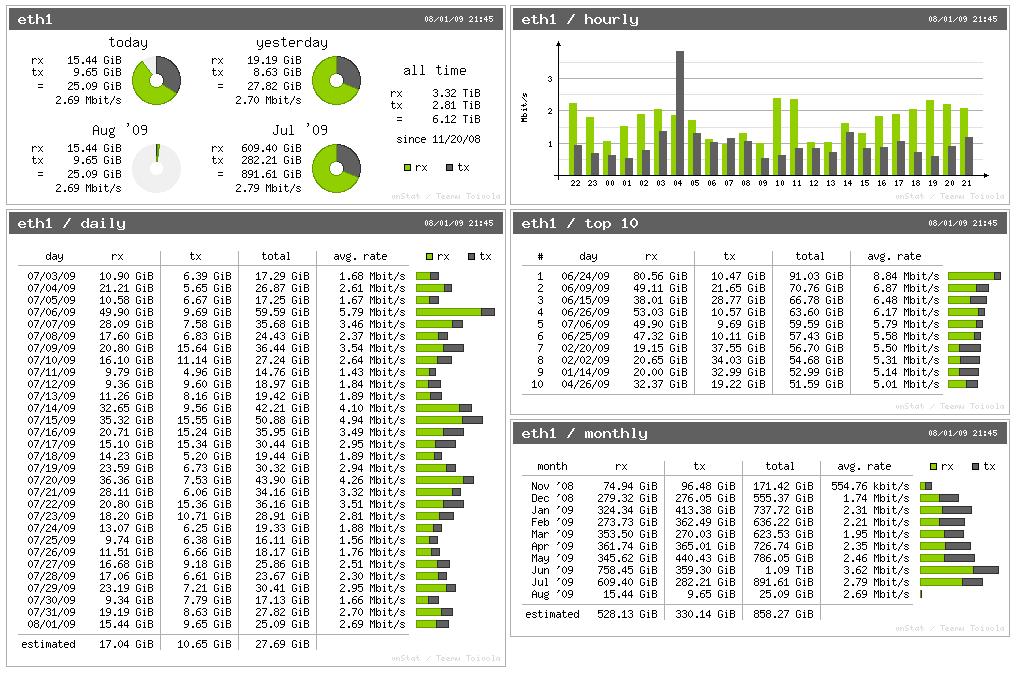
One advantage it has over a similar tool is that it logs network traffic and bandwidth usage statistics for later analysis – this is its default behavior. You can actually view these logs even after the system reboots.
Install VnStat in Linux
$ sudo yum install sysstat      [On Older CentOS/RHEL & Fedora]
$ sudo dnf install sysstat      [On CentOS/RHEL/Fedora/Rocky Linux & AlmaLinux]
$ sudo apt-get install sysstat  [On Debian/Ubuntu & Mint]
$ sudo pacman -S sysstat        [On Arch Linux]
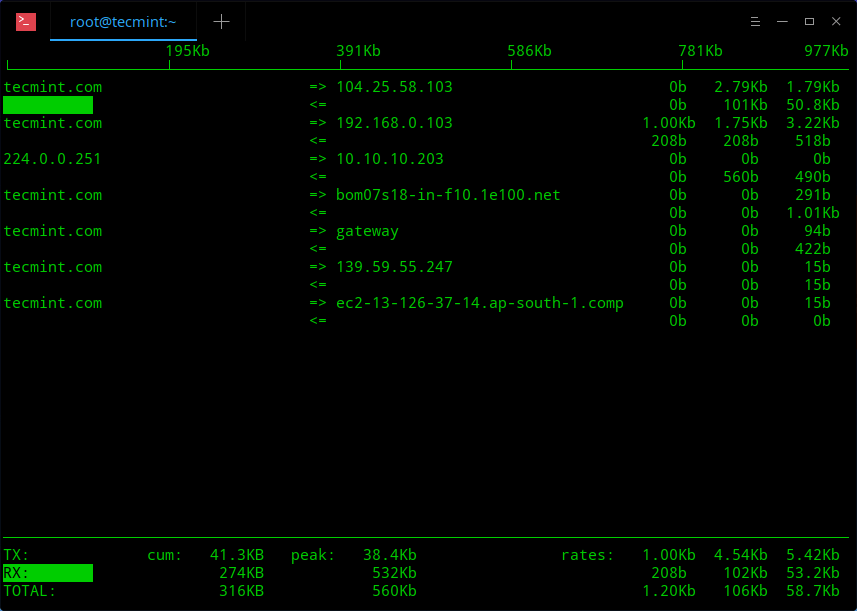
4. iftop – Displays Bandwidth Usage
iftop is a simple, easy-to-use, real-time top-like command line-based network bandwidth monitoring tool, used to get a quick overview of network activities on an interface. It displays network usage bandwidth updates every 2, 10, and 40 seconds on average.
Install iftop in Linux
$ sudo yum install iftop      [On Older CentOS/RHEL & Fedora]
$ sudo dnf install iftop      [On CentOS/RHEL/Fedora/Rocky Linux & AlmaLinux]
$ sudo apt-get install iftop  [On Debian/Ubuntu & Mint]
$ sudo pacman -S iftop        [On Arch Linux]
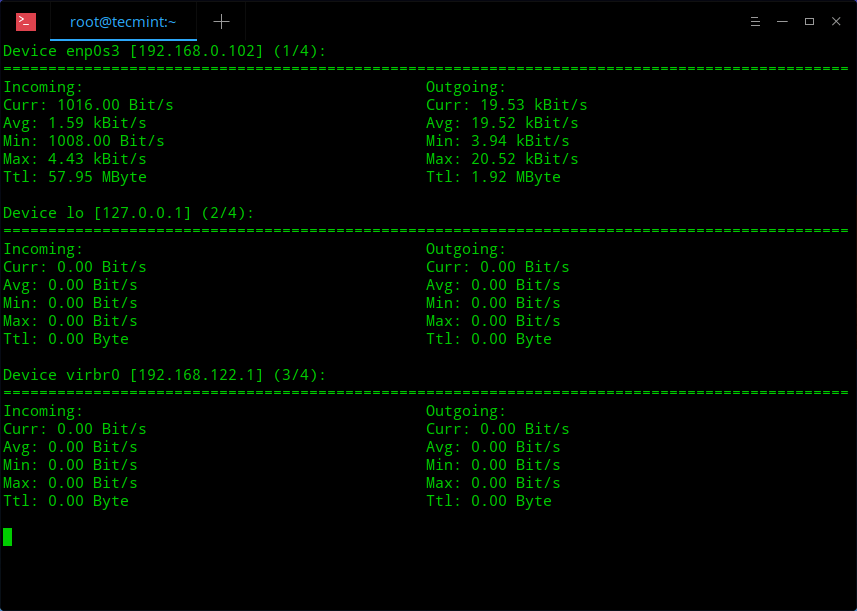
5. nload – Displays Network Usage
nload is another simple, easy-to-use command-line tool for monitoring network traffic and bandwidth usage in real-time. It uses graphs to help you monitor inbound and outbound traffic. In addition, it also displays information such as the total amount of transferred data and min/max network usage.
Install nload in Linux
$ sudo yum install nload      [On Older CentOS/RHEL & Fedora]
$ sudo dnf install nload      [On CentOS/RHEL/Fedora/Rocky Linux & AlmaLinux]
$ sudo apt-get install nload  [On Debian/Ubuntu & Mint]
$ sudo pacman -S nload        [On Arch Linux]
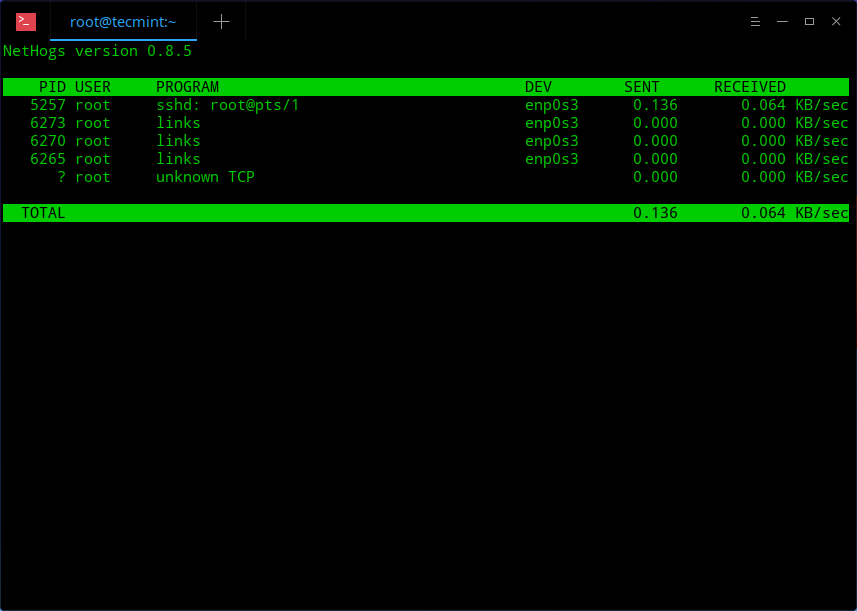
6. NetHogs – Monitor Network Traffic Bandwidth
NetHogs is a tiny top-like, text-based tool to monitor real-time network traffic bandwidth usage by each process or application running on a Linux system. It simply offers real-time statistics of your network bandwidth usage on a per-process basis.
Install NetHogs in Linux
$ sudo yum install nethogs      [On Older CentOS/RHEL & Fedora]
$ sudo dnf install nethogs      [On CentOS/RHEL/Fedora/Rocky Linux & AlmaLinux]
$ sudo apt-get install nethogs  [On Debian/Ubuntu & Mint]
$ sudo pacman -S nethogs        [On Arch Linux]
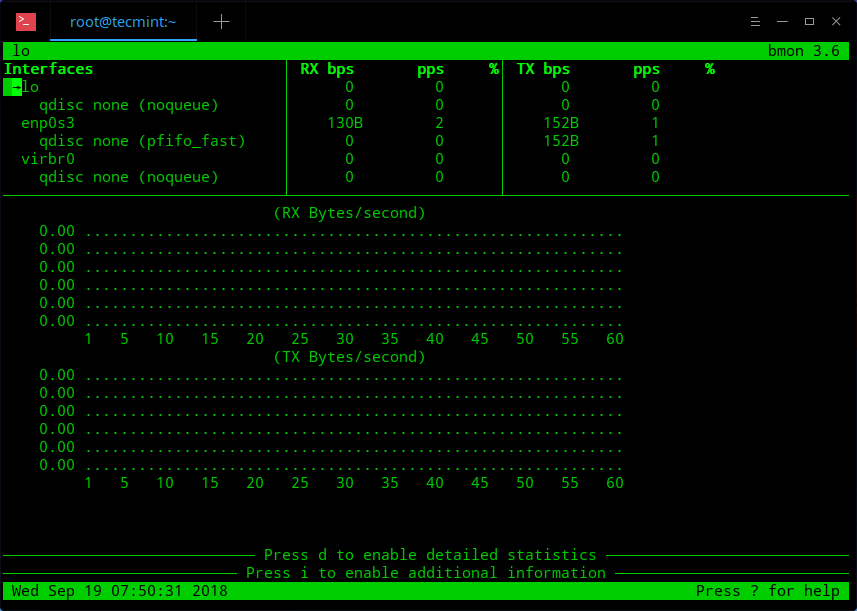
7. bmon – Bandwidth Monitor and Rate Estimator
bmon is also a straightforward command-line tool for monitoring network bandwidth utilization and a rate estimator, in Linux. It captures network statistics and visualizes them in a human-friendly format so that you can keep an eye on your system.
Install Bmon in Linux
$ sudo yum install bmon      [On Older CentOS/RHEL & Fedora]
$ sudo dnf install bmon      [On CentOS/RHEL/Fedora/Rocky Linux & AlmaLinux]
$ sudo apt-get install bmon  [On Debian/Ubuntu & Mint]
$ sudo pacman -S bmon        [On Arch Linux]
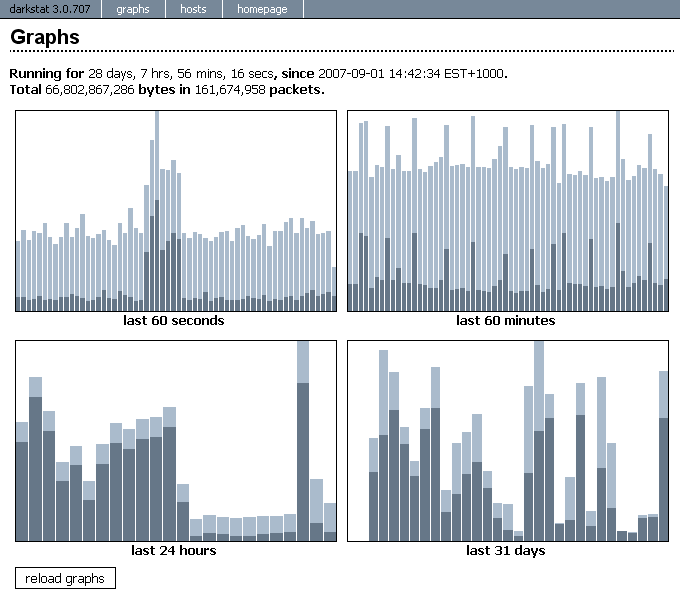
8. Darkstat – Captures Network Traffic
Darkstat is a small, simple, cross-platform, real-time, efficient web-based network traffic analyzer. It is a network statistics monitoring tool that works by capturing network traffic, and computer usage statistics, and serves the reports over HTTP in a graphical format. You can also use it via the command line to get the same results.
Install Darkstat in Linux
$ sudo yum install darkstat      [On Older CentOS/RHEL & Fedora]
$ sudo dnf install darkstat      [On CentOS/RHEL/Fedora/Rocky Linux & AlmaLinux]
$ sudo apt-get install darkstat  [On Debian/Ubuntu & Mint]
$ sudo pacman -S darkstat        [On Arch Linux]
9. IPTraf – An IP Network Monitor
IPTraf is an easy-to-use, ncurses-based and configurable tool for monitoring incoming and outgoing network traffic passing through an interface. It is useful for IP traffic monitoring, and viewing general interface statistics, detailed interface statistics and so much more.
Install IPTraf in Linux
$ sudo yum install iptraf      [On Older CentOS/RHEL & Fedora]
$ sudo dnf install iptraf      [On CentOS/RHEL/Fedora/Rocky Linux & AlmaLinux]
$ sudo apt-get install iptraf  [On Debian/Ubuntu & Mint]
$ sudo pacman -S iptraf        [On Arch Linux]
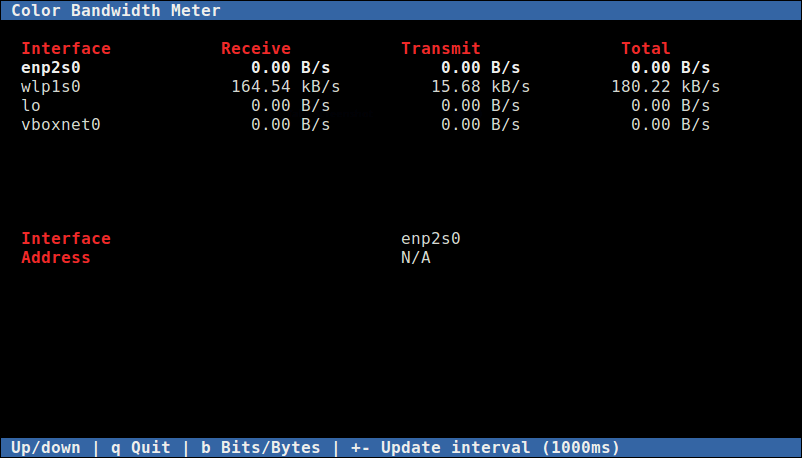
10. CBM – (Color Bandwidth Meter)
CBM is a tiny command-line utility for displaying current network traffic on all connected devices in colored output in Ubuntu Linux and its derivatives such as Linux Mint, Lubuntu, and many others. It shows each connected network interface, bytes received, bytes transmitted, and total bytes, allowing you to monitor network bandwidth.
Install Color Bandwidth Meter in Linux
$ sudo yum install cbm      [On Older CentOS/RHEL & Fedora]
$ sudo dnf install cbm      [On CentOS/RHEL/Fedora/Rocky Linux & AlmaLinux]
$ sudo apt-get install cbm  [On Debian/Ubuntu & Mint]
$ sudo pacman -S cbm        [On Arch Linux]
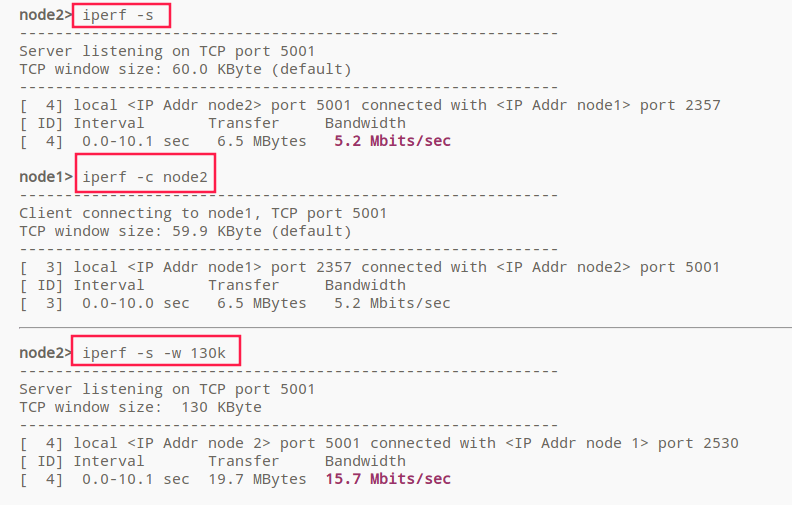
11. Iperf/Iperf3 – Network Bandwidth Measurement Tool
Iperf/Iperf3 is a powerful tool for measuring network throughput over protocols such as TCP, UDP, and SCTP. It is primarily built to help in tuning TCP connections over a particular path, thus useful for testing and monitoring the maximum achievable bandwidth on IP networks (supports both IPv4 and IPv6).
It requires a server and a client to perform tests (which report the bandwidth, loss, and other useful network performance parameters).
Install Iperf3 in Linux
$ sudo yum install iperf3      [On Older CentOS/RHEL & Fedora]
$ sudo dnf install iperf3      [On CentOS/RHEL/Fedora/Rocky Linux & AlmaLinux]
$ sudo apt-get install iperf3  [On Debian/Ubuntu & Mint]
$ sudo pacman -S iperf3        [On Arch Linux]
12. Netperf – Network Bandwidth Testing
Netperf is similar to iperf, for testing network performance. It can help in monitoring network bandwidth in Linux by measuring data transfer using either TCP, UDP. It also supports measurements via Berkeley Sockets interface, DLPI, Unix Domain Sockets, and so many other interfaces. You need a server and a client to run tests.
Install Netperf in Linux
$ sudo yum install netperf      [On Older CentOS/RHEL & Fedora]
$ sudo dnf install netperf      [On CentOS/RHEL/Fedora/Rocky Linux & AlmaLinux]
$ sudo apt-get install netperf  [On Debian/Ubuntu & Mint]
$ sudo pacman -S netperf        [On Arch Linux]
13. SARG – Squid Analysis Report Generator
SARG is a squid log files analyzer and internet bandwidth monitoring tool. It produces useful HTML reports with information including but not limited to IP addresses, and total bandwidth usage. It is a handy tool for monitoring internet bandwidth utilization by individual machines on a single network.
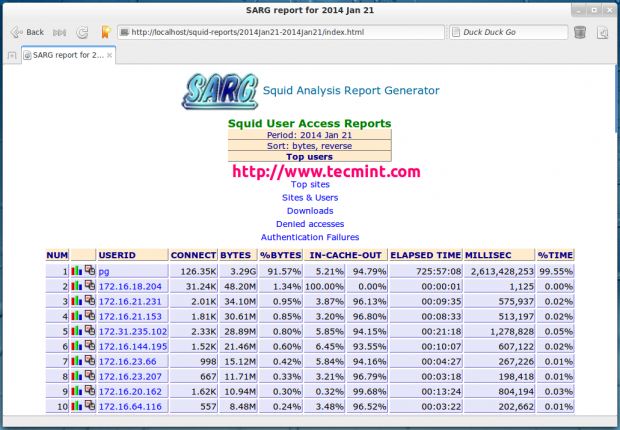
For installation instruction and usage, check out our article – How to Install SARG to Monitor Squid Internet Bandwidth Usage.
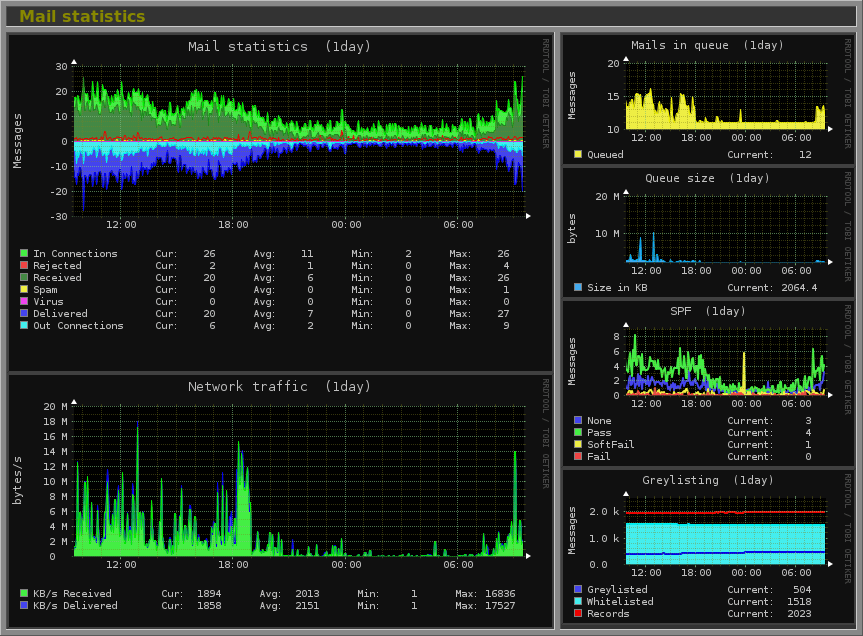
14. Monitorix – System and Network Monitoring Tool
Monitorix is a lightweight system resources and network monitoring application, designed for small Linux/Unix servers and also comes with amazing support for embedded devices.
It helps you monitor network traffic and usage statistics from an unlimited number of network devices. It supports IPv4 and IPv6 connections including packet traffic and traffic error graphs and supports up to 9 discs per network interface.
Install Monitorix in Linux
$ sudo yum install monitorix      [On Older CentOS/RHEL & Fedora]
$ sudo dnf install monitorix      [On CentOS/RHEL/Fedora/Rocky Linux & AlmaLinux]
$ sudo apt-get install monitorix  [On Debian/Ubuntu & Mint]
$ sudo pacman -S monitorix        [On Arch Linux]
15. Cacti – Network Monitoring and Graphing Tool
Cacti is a fully functional, web-based network graphing PHP application with an intuitive, easy-to-use interface. It uses MySQL database for storing data collected network performance data, used to produce customized graphing. It is a frontend to RRDTool, useful for monitoring small to complex networks with thousands of devices.
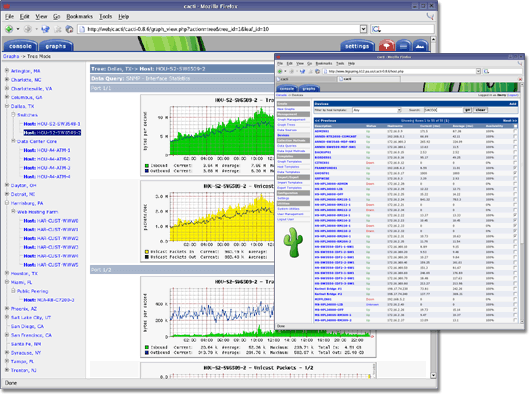
For installation instruction and usage, check out our article – Install Cacti (Network Monitoring) on Linux.
16. Observium – Network Monitoring Platform
Observium is a fully-featured network monitoring platform with an elegant and powerful, robust yet simple and intuitive interface. It supports a number of platforms including, Linux, Windows, FreeBSD, Cisco, HP, Dell, and many others, and includes autodetection of devices. It helps users to gather network metrics and offers intuitive graphing of device metrics from collected performance data.
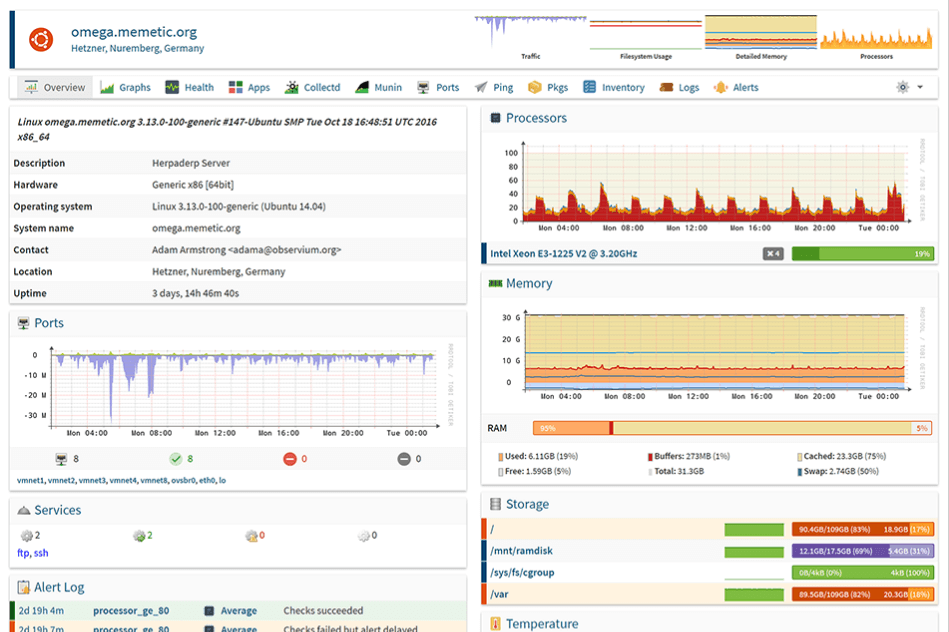
For installation instruction and usage, check out our article – How to Install Observium – A Complete Network Management and Monitoring System.
17. Zabbix – Application and Network Monitoring Tool
Zabbix is a feature-rich, commonly used network monitoring platform, designed in a server-client model, to monitor networks, servers, and applications in real-time. It collects different types of data that are used for a visual representation of network performance or load metrics of the monitored devices.
It is capable of working with well-known networking protocols such as HTTP, FTP, SMTP, IMAP, and many more, without the need to install additional software on the monitored devices.

For installation instruction and usage, check out our article – How to Install Zabbix – A Complete Network Monitoring Solution for Linux.
18. Nagios – Monitors Systems, Networks, and Infrastructure
Nagios is a robust, powerful, feature-rich, and widely used monitoring software. It allows you to monitor local and remote network devices and their services from a single window.
It offers bandwidth monitoring in network devices such as switches and Routers via SNMP thus enabling you to easily find out over-utilized ports, and pinpoint possible network abusers.
Read Also: 13 Linux Network Configuration and Troubleshooting Commands
In addition, Nagios also helps you to keep an eye on per-port bandwidth utilization and errors and supports fast detection of network outages and protocol failures.
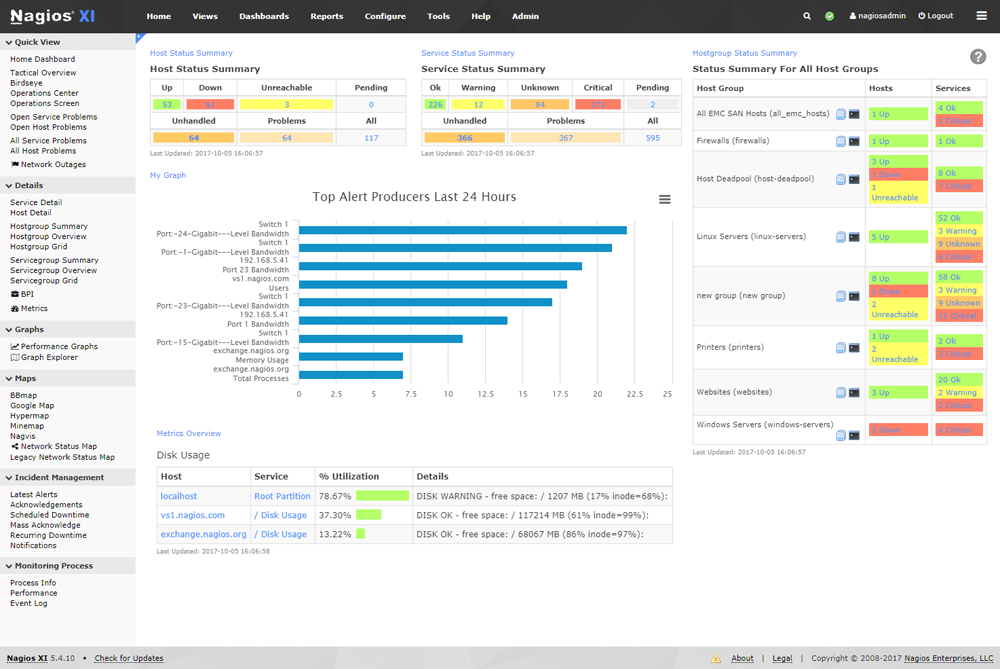
For installation instruction and usage, check out our article – How to Install Nagios – A Complete IT Infrastructure Monitoring Solution for Linux.
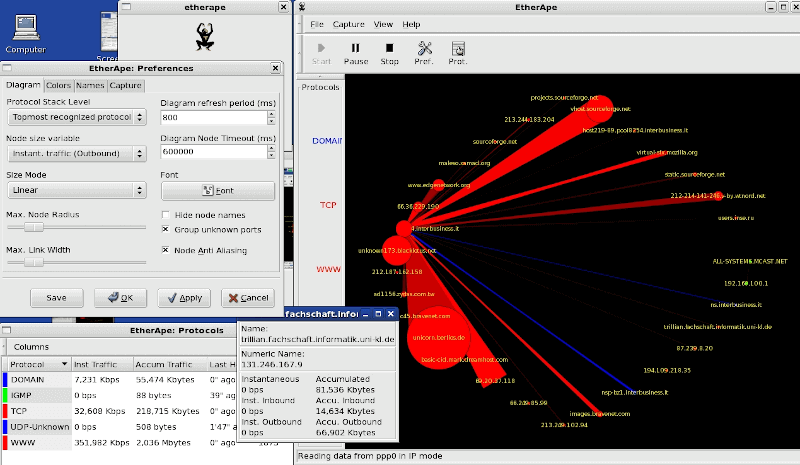
19. EtherApe – Network Monitoring
EtherApe is an another graphical Linux network monitoring tool that displays your network activity graphically. It supports wide range of devices such as Ethernet, FDDI, Token Ring, ISDN, PPP, SLIP and WLAN.
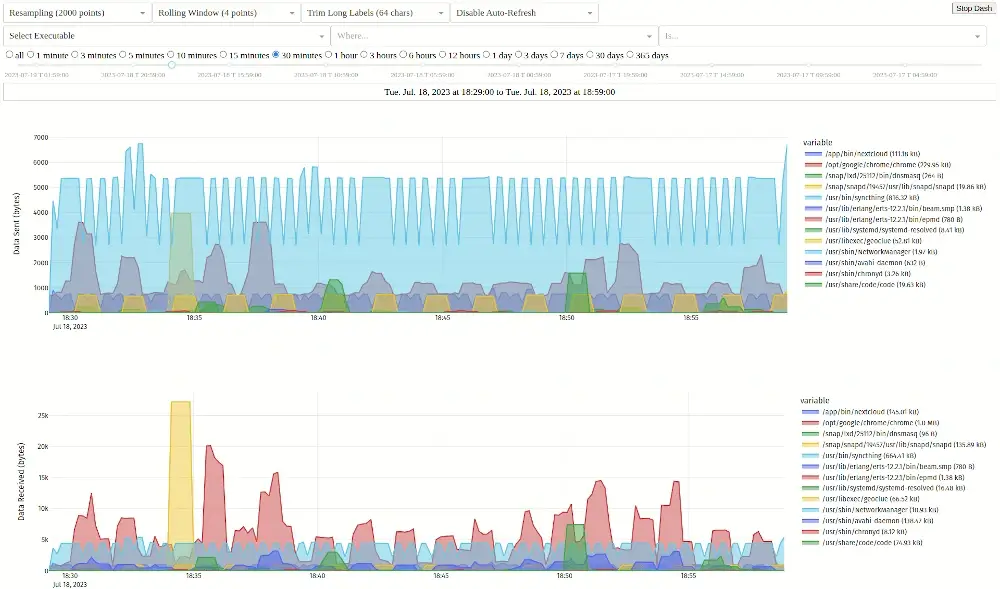
20. Picosnitch
Picosnitch serves as a per-application bandwidth monitoring tool that provides real-time notifications to users whenever new applications establish internet connections or when an application’s hash has undergone changes since its last connection.
It features a terminal-based user interface, allowing users to easily navigate and filter their traffic history by various parameters, including time, executable, sha256 hash, parent process of the executable, user ID, local and remote ports, local and remote addresses, and even domains.
Summary
In this article, we have reviewed a number of useful network bandwidth and system monitoring tools for Linux. If we’ve missed including any monitoring tool in the list, do share with us in the comment form below.


Some of these tools are starting to show their age, there’s a new one called picosnitch that is worth checking out.
@Chris,
Thank you for the suggestion! It’s always great to hear about new tools and updates in the tech world. I’ll definitely look into picosnitch.
Your Cacti images are real old. Goto the Cacti.net website to see the new look and feel.
Hi,
Very nice and great article…
Thanks a lot
Which KPIs I must use to measure the network performance of my Linux server?
very nice, great article on Linux network bandwidth monitoring.
Thanks
Hi thanks for the post, I am searching for a tool in ubuntu 18.04 that tracks down internet disconnections in seconds or minutes, can you suggest any for this task?
@Nicolas
I have not come across such a tool(that tracks down internet disconnections in seconds or minutes), but let me do a little research to find out if there is one for Linux, particularly Ubuntu.
Thanks for sharing such an informative post!
I think you can additionally use free small utils: EasyNetMonitor or Fiddler.
@Manro
Many thanks for sharing the additional tools. We are grateful.
if you need some tiny graphical widget, try https://github.com/ashtum/ashmon.
@Alborz
Thanks a lot for sharing this, we will check it out.
Wireshark
Excellent article, I have linked to it on my website, The Ultimate Linux Newbie Guide
@Alistair
We are truly grateful for the act of goodness towards our efforts. Many thanks for linking this article to your website. Feedback such as this one make the effort worthwhile.
At work we use Monit for basic monitoring, very easy to setup, easy to write check rules and easy to deploy via config mgmt.
Nagios is a nightmare compared to Monit.
@mike
Many thanks for sharing your experience with us.
Very nice list. I favor the Ncurses interfaces sometimes. I like Nagios but it really needs a simplified interface to set it up. You shouldn’t have to spend a month understanding it to get it to do ANYTHING…
@James
Remember to share this article on all your social media platforms. Thanks for sharing your thoughts with us.