VnStat is a console-based network traffic monitoring tool design for Linux and BSD. It will keep a log of the network traffic for selected network interfaces. To generate the logs, vnStat uses the information provided by the kernel.
In other words, it will not sniff the network traffic and will ensure the lite usage of the system resource. To use this software under Linux you will need at least version 2.2 of the kernel series.
The latest version of vnStat 2.6 has been released on January 21, 2020, and includes several following features and fixes.
Features
- Statistics remain available even after system reboots
- Monitor multiple network interfaces at the same time
- Multiple output options
- Sort the data by hour, day, month, week or get the top 10 days
- Generate png graphic of the output
- Configure “Months” to follow up with different billing cycles you may have
- Very light – consumes a really small portion of your system resources
- Low CPU usage no matter how much traffic you generate
- You don’t have to be root to use it
- Select units dynamically (KB, MB, etc)
- vnStati provides some new options like:
- -nl / –nolegend (hides the rx/tx legend)
- –altdate – use alternative date/time text location
- –headertext – to customize the text in the image header.
- You can generate output in image format.
- Customizable options for content positioning and image background color to vnStat.cgi.
- The interface bandwidth will be automatically detected.
- Use JSON for output
In this article, we will show you how to install the vnStat and vnStati tool under Linux systems to monitor real-time network traffic.
Installing vnStat and vnStati Network Monitoring Tools
1. To install vnStat in Linux, you will need to download the latest version from its official GitHub release page.
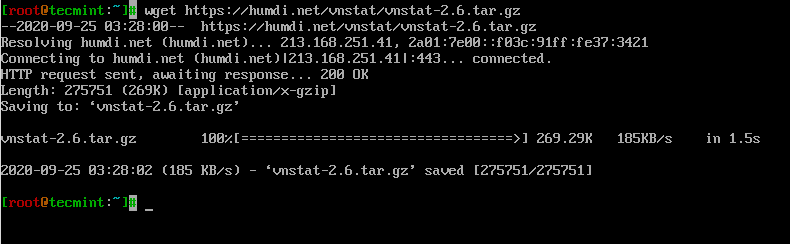
Alternatively, you can also use the following wget command to download the latest source tarball as shown below.
# wget https://humdi.net/vnstat/vnstat-2.6.tar.gz
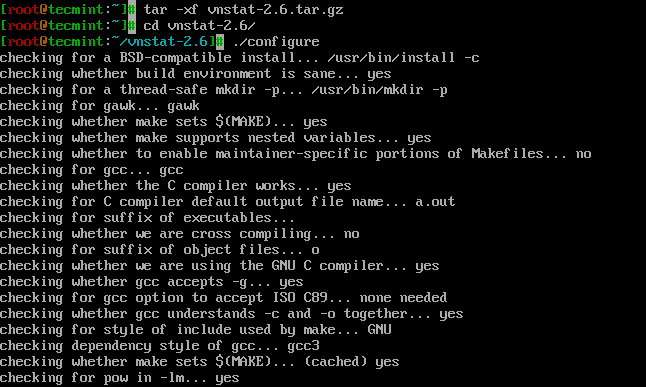
2. Once you have downloaded the file, extract the archive using your terminal and then navigate to the location where you have extracted the archive and compile it using the following commands.
Note: The source package comes with the needed source files for vnStat including the daemon (vnstatd) and image output (vnstati).
Install VnStat in CentOS/RHEL and Fedora
# yum group install "Development Tools"
# yum install gd gd-devel sqlite-devel
# tar -xvf vnstat-2.6.tar.gz
# cd vnstat-2.6/
# ./configure --prefix=/usr --sysconfdir=/etc
# make
# make install
Install VnStat in Debian and Ubuntu
$ sudo apt-get install build-essential gd gd-devel libsqlite3-dev
$ tar -xvf vnstat-2.6.tar.gz
$ cd vnstat-2.6/
$ sudo ./configure --prefix=/usr --sysconfdir=/etc
$ sudo make
$ sudo make install
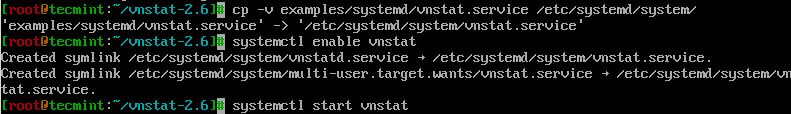
3. Once the install has finished, you will need to copy the Vnstat service file as shown.
VnStat Systemd
# cp -v examples/systemd/vnstat.service /etc/systemd/system/
# systemctl enable vnstat
# systemctl start vnstat
Vnstat Init.d
# cp -v examples/init.d/redhat/vnstat /etc/init.d/
# chkconfig vnstat on
# service vnstat start
4. Now verify that the binaries got installed to a suitable location and are of the correct version.
# vnstat

vnStat 2.6 by Teemu Toivola <tst at iki dot fi>
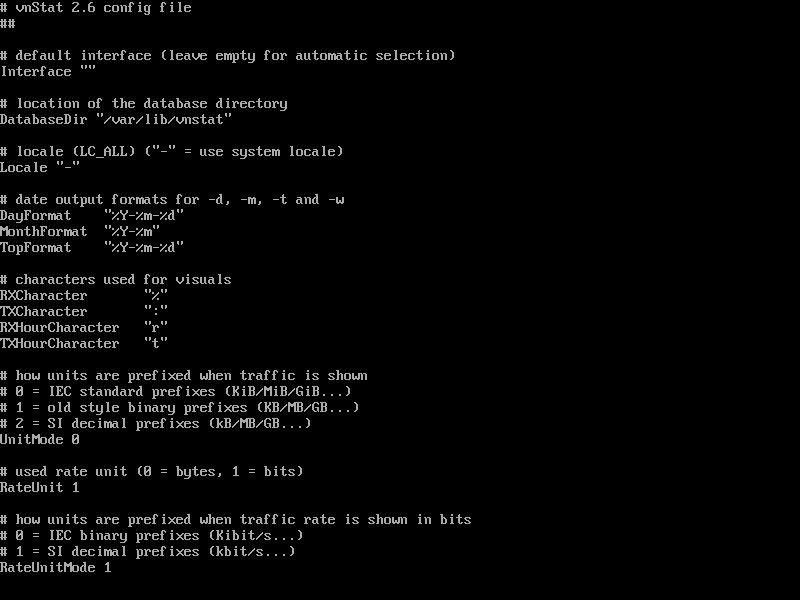
5. If you wish to customize your vnStat configuration you can open its configuration file located at:
# vi /etc/vnstat.conf
The options there are self-explanatory so I won’t be stopping on each one of them. You can still review them if you wish to customize your installation.
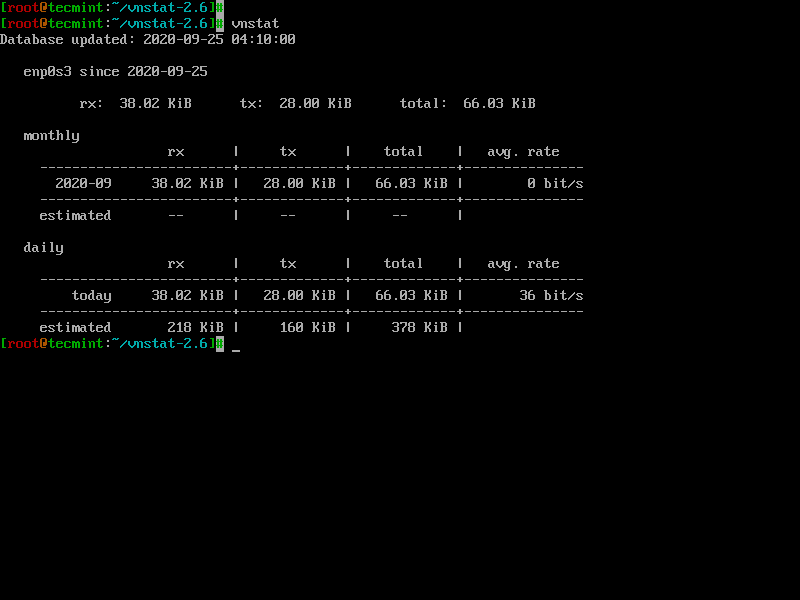
6. You would need to allow some time for the stats to be updated in the database. Once you have enough information written in the database you can see the network stats by simply running:
# vnstat
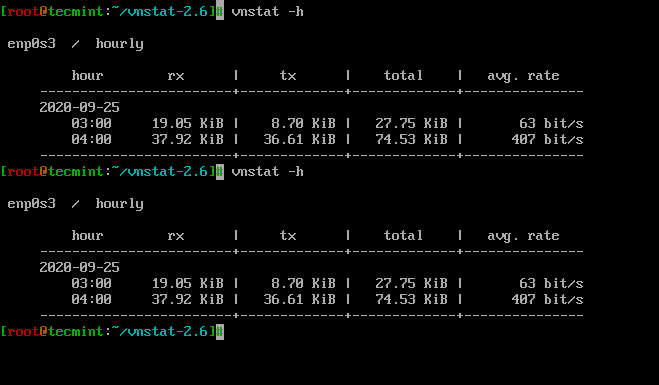
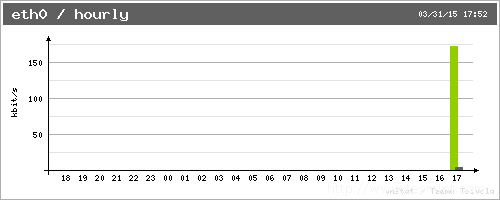
7. Yon can also check the hourly stats by using the -h option:
# vnstat -h
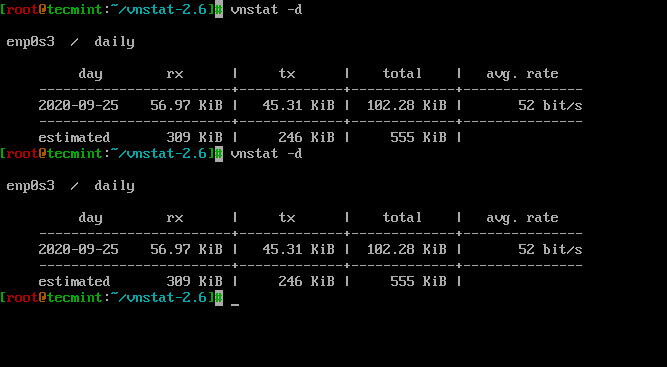
8. For daily stats, you will need to use the -d option:
# vnstat -d
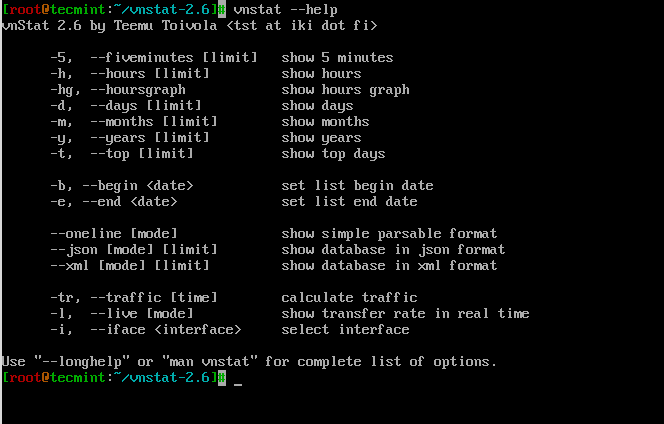
9. For more available options you can use the --help:
# vnstat --help
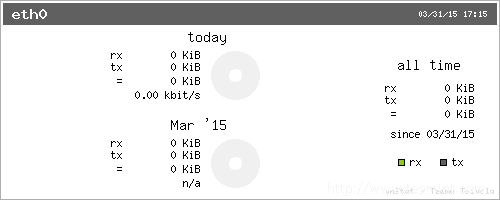
10. To make the stats easier to read you can use the vnStati tool to generate .png images for vnStat.
VnStati is automatically installed along vnStat so no further installation actions would be required. To generate a summary image for the network usage of your network interface, you can run:
# vnstati -s -i eth0 -o ~/network-log.png
# vnstati -h -i eth0 -o ~/network-log.png
In my case, vnStat was just recently installed, but those will get populated over time. For more available options and different stats you can use the –help option:
The information that both vnStat and vnStati provide can greatly help your network monitoring, analysis, and troubleshooting in time. You may find more information about the available options of vnStat in the man page of the tool.
If you have an additional suggestion or question about vnStat and vnStati please do not hesitate to submit your comment in the comment section below.


