Command-line tools like “top” make it hard to monitor CPU usage and memory usage. That’s why we today introduce you to vtop – is a free and open-source, simple yet powerful and extendable terminal activity monitoring tool written in Node.js.
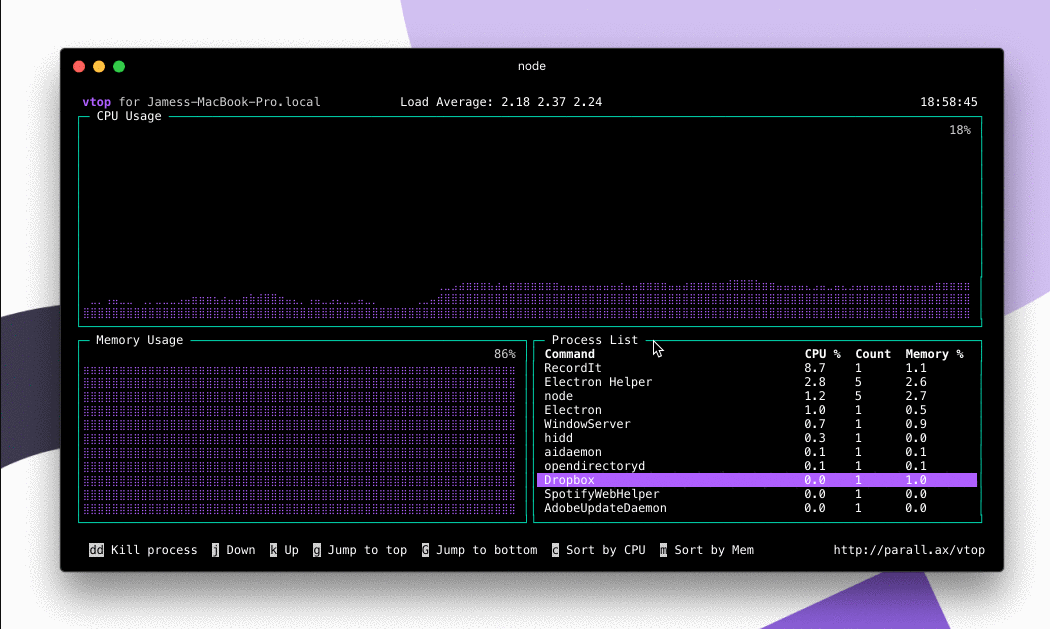
It is designed to make it easy for users to view CPU usage across multi-process applications (those that have a master process and child processes, for example, NGINX, Apache, Chrome, etc.). vtop also makes it easy to see spikes over time as well as memory usage.
vtop uses Unicode braille characters to draw and display CPU and Memory usage charts, helping you visualize spikes. Additionally, it group processes with the same name (master and all child processes) together.
In this article, you will learn how to install vtop monitoring tool in Linux.
Requirements:
As a prerequisite, your system must have Node.js and NPM installed, otherwise, see this guide:
Installing vtop in Linux Systems
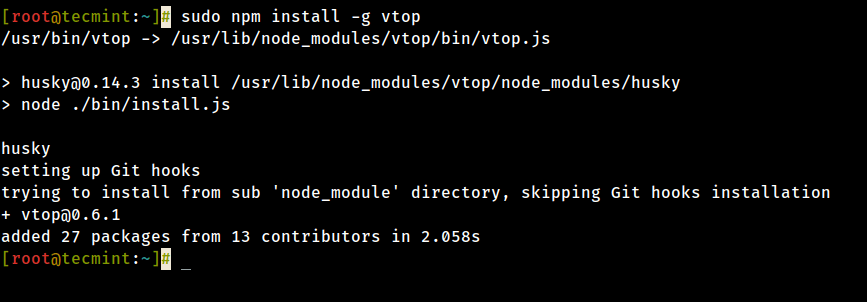
Once your system has Node.js and NPM installed, run the following command to install vtop. Use the sudo command if necessary to gain root privileges for package installation.
# sudo npm install -g vtop
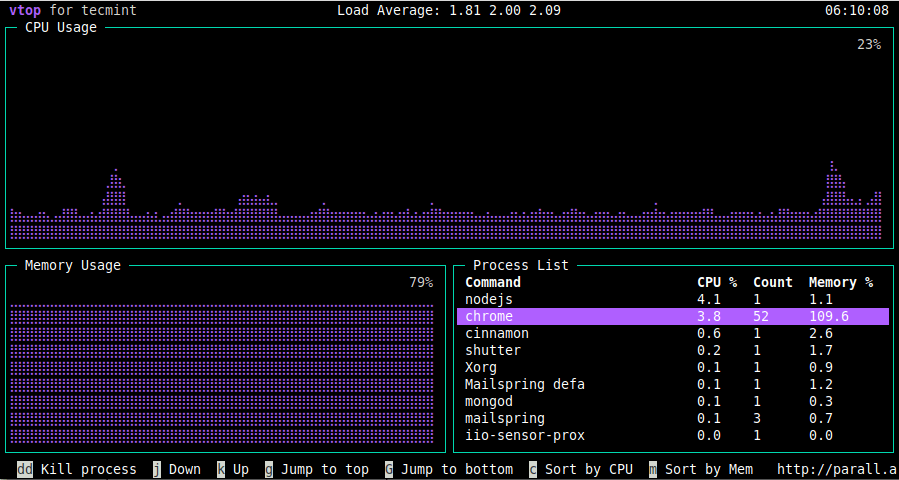
After installing vtop, run the following command to launch it.
# vtop
The following are vtop keyboard shortcuts, pressing:
uupdates to the latest version of vtop.kor arrow up moves up the process list.jor arrow down moves down the process list.gtakes you to the top of the process list.Gtakes you to the end of the list.ddkill all the processes in that group (you have to select the process name first).
To change the color scheme, use the --theme switch. You can choose any of the available themes (acid, becca, brew, certs, dark, gooey, gruvbox, monokai, nord, parallax, seti, and wizard), for example:
# vtop --theme wizard
To set the interval between updates (in milliseconds), use the --update-interval. In this example, 20 milliseconds is equivalent to 0.02 seconds:
# vtop --update-interval 20
You can also set vtop to terminate after some seconds, using the --quit-after option as shown.
# vtop --quit-after 5
To get vtop help, run the following command.
# vtop -h
vtop has many features in the pipeline including measuring server requests, log entries, etc. What do you think about vtop? Let us know via the comment form below.


Hi,
Thanks a lot
very useful command
@Jalal
Great! Thanks for the useful feedback.