Although Linux is very reliable, wise system administrators should find a way to keep an eye on the system’s behaviour and utilization at all times. Ensuring an uptime as close to 100% as possible and the availability of resources are critical needs in many environments. Examining the past and current status of the system will allow us to foresee and most likely prevent possible issues.

Introducing The Linux Foundation Certification Program
In this article we will present a list of a few tools that are available in most upstream distributions to check on the system status, analyze outages, and troubleshoot ongoing issues. Specifically, of the myriad of available data, we will focus on CPU, storage space and memory utilization, basic process management, and log analysis.
Storage Space Utilization
There are 2 well-known commands in Linux that are used to inspect storage space usage: df and du.
The first one, df (which stands for disk free), is typically used to report overall disk space usage by file system.
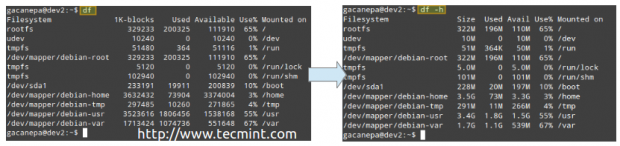
Example 1: Reporting disk space usage in bytes and human-readable format
Without options, df reports disk space usage in bytes. With the -h flag it will display the same information using MB or GB instead. Note that this report also includes the total size of each file system (in 1-K blocks), the free and available spaces, and the mount point of each storage device.
# df
# df -h
That’s certainly nice – but there’s another limitation that can render a file system unusable, and that is running out of inodes. All files in a file system are mapped to an inode that contains its metadata.
Example 2: Inspecting inode usage by file system in human-readable format with
# df -hTi
you can see the amount of used and available inodes:
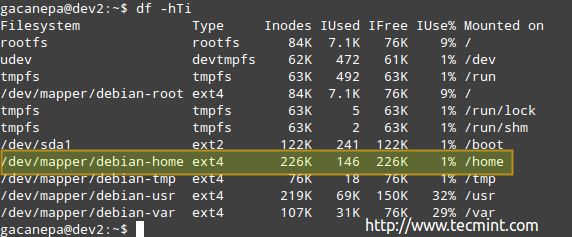
According to the above image, there are 146 used inodes (1%) in /home, which means that you can still create 226K files in that file system.
Example 3: Finding and / or deleting empty files and directories
Note that you can run out of storage space long before running out of inodes, and vice-versa. For that reason, you need to monitor not only the storage space utilization but also the number of inodes used by file system.
Use the following commands to find empty files or directories (which occupy 0B) that are using inodes without a reason:
# find  /home -type f -empty
# find  /home -type d -empty
Also, you can add the -delete flag at the end of each command if you also want to delete those empty files and directories:
# find  /home -type f -empty --delete
# find  /home -type f -empty
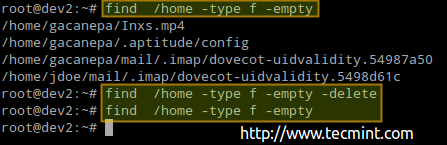
The previous procedure deleted 4 files. Let’s check again the number of used / available nodes again in /home:
# df -hTi | grep home
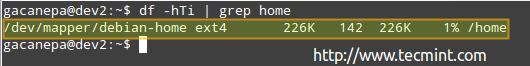
As you can see, there are 142 used inodes now (4 less than before).
Example 4: Examining disk usage by directory
If the use of a certain file system is above a predefined percentage, you can use du (short for disk usage) to find out what are the files that are occupying the most space.
The example is given for /var, which as you can see in the first image above, is used at its 67%.
# du -sch /var/*
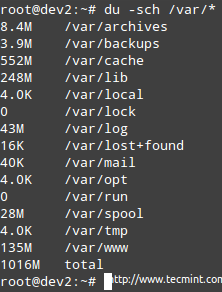
Note: That you can switch to any of the above subdirectories to find out exactly what’s in them and how much each item occupies. You can then use that information to either delete some files if there are not needed or extend the size of the logical volume if necessary.
Read Also
- 12 Useful “df” Commands to Check Disk Space
- 10 Useful “du” Commands to Find Disk Usage of Files and Directories
Memory and CPU Utilization
The classic tool in Linux that is used to perform an overall check of CPU / memory utilization and process management is top command. In addition, top displays a real-time view of a running system. There other tools that could be used for the same purpose, such as htop, but I have settled for top because it is installed out-of-the-box in any Linux distribution.
Example 5: Displaying a live status of your system with top
To start top, simply type the following command in your command line, and hit Enter.
# top
Let’s examine a typical top output:
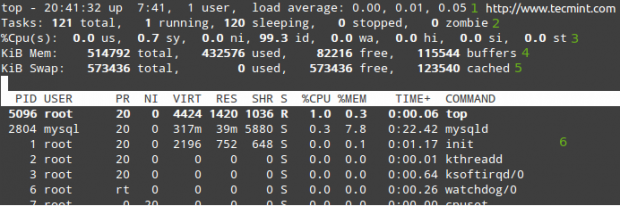
In rows 1 through 5 the following information is displayed:
1. The current time (8:41:32 pm) and uptime (7 hours and 41 minutes). Only one user is logged on to the system, and the load average during the last 1, 5, and 15 minutes, respectively. 0.00, 0.01, and 0.05 indicate that over those time intervals, the system was idle for 0% of the time (0.00: no processes were waiting for the CPU), it then was overloaded by 1% (0.01: an average of 0.01 processes were waiting for the CPU) and 5% (0.05). If less than 0 and the smaller the number (0.65, for example), the system was idle for 35% during the last 1, 5, or 15 minutes, depending where 0.65 appears.
2. Currently there are 121 processes running (you can see the complete listing in 6). Only 1 of them is running (top in this case, as you can see in the %CPU column) and the remaining 120 are waiting in the background but are “sleeping” and will remain in that state until we call them. How? You can verify this by opening a mysql prompt and execute a couple of queries. You will notice how the number of running processes increases.
Alternatively, you can open a web browser and navigate to any given page that is being served by Apache and you will get the same result. Of course, these examples assume that both services are installed in your server.
3. us (time running user processes with unmodified priority), sy (time running kernel processes), ni (time running user processes with modified priority), wa (time waiting for I/O completion), hi (time spent servicing hardware interrupts), si (time spent servicing software interrupts), st (time stolen from the current vm by the hypervisor – only in virtualized environments).
4. Physical memory usage.
5. Swap space usage.
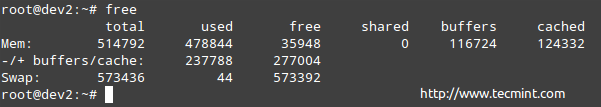
Example 6: Inspecting physical memory usage
To inspect RAM memory and swap usage you can also use free command.
# free
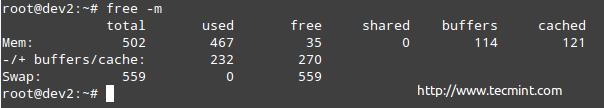
Of course you can also use the -m (MB) or -g (GB) switches to display the same information in human-readable form:
# free -m
Either way, you need to be aware of the fact that the kernel reserves as much memory as possible and makes it available to processes when they request it. Particularly, the “-/+ buffers/cache” line shows the actual values after this I/O cache is taken into account.
In other words, the amount of memory used by processes and the amount available to other processes (in this case, 232 MB used and 270 MB available, respectively). When processes need this memory, the kernel will automatically decrease the size of the I/O cache.
Read Also: 10 Useful “free” Command to Check Linux Memory Usage
Taking a Closer Look at Processes
At any given time, there many processes running on our Linux system. There are two tools that we will use to monitor processes closely: ps and pstree.
Example 7: Displaying the whole process list in your system with ps (full standard format)
Using the -e and -f options combined into one (-ef) you can list all the processes that are currently running on your system. You can pipe this output to other tools, such as grep (as explained in Part 1 of the LFCS series) to narrow down the output to your desired process(es):
# ps -ef | grep -i squid | grep -v grep
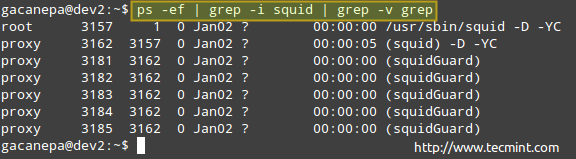
The process listing above shows the following information:
owner of the process, PID, Parent PID (the parent process), processor utilization, time when command started, tty (the ? indicates it’s a daemon), the cumulated CPU time, and the command associated with the process.
Example 8: Customizing and sorting the output of ps
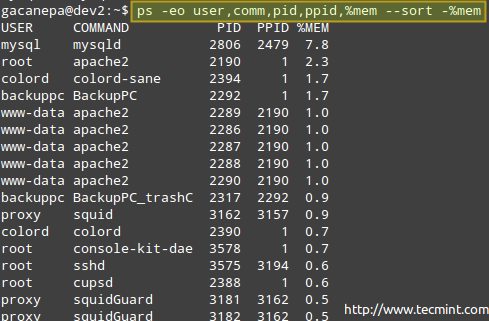
However, perhaps you don’t need all that information, and would like to show the owner of the process, the command that started it, its PID and PPID, and the percentage of memory it’s currently using – in that order, and sort by memory use in descending order (note that ps by default is sorted by PID).
# ps -eo user,comm,pid,ppid,%mem --sort -%mem
Where the minus sign in front of %mem indicates sorting in descending order.
If for some reason a process starts taking too much system resources and it’s likely to jeopardize the overall functionality of the system, you will want to stop or pause its execution passing one of the following signals using the kill program to it. Other reasons why you would consider doing this is when you have started a process in the foreground but want to pause it and resume in the background.
| Signal name | Signal number | Description |
| SIGTERM | 15 | Kill the process gracefully. |
| SIGINT | 2 | This is the signal that is sent when we press Ctrl + C. It aims to interrupt the process, but the process may ignore it. |
| SIGKILL | 9 | This signal also interrupts the process but it does so unconditionally (use with care!) since a process cannot ignore it. |
| SIGHUP | 1 | Short for “Hang UP”, this signals instructs daemons to reread its configuration file without actually stopping the process. |
| SIGTSTP | 20 | Pause execution and wait ready to continue. This is the signal that is sent when we type the Ctrl + Z key combination. |
| SIGSTOP | 19 | The process is paused and doesn’t get any more attention from the CPU cycles until it is restarted. |
| SIGCONT | 18 | This signal tells the process to resume execution after having received either SIGTSTP or SIGSTOP. This is the signal that is sent by the shell when we use the fg or bg commands. |
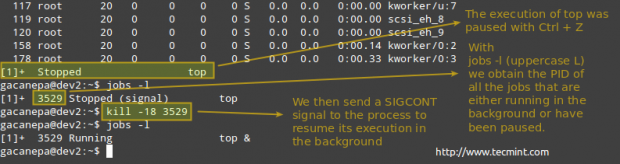
Example 9: Pausing the execution of a running process and resuming it in the background
When the normal execution of a certain process implies that no output will be sent to the screen while it’s running, you may want to either start it in the background (appending an ampersand at the end of the command).
process_name &
or,
Once it has started running in the foreground, pause it and send it to the background with
Ctrl + Z
# kill -18 PID
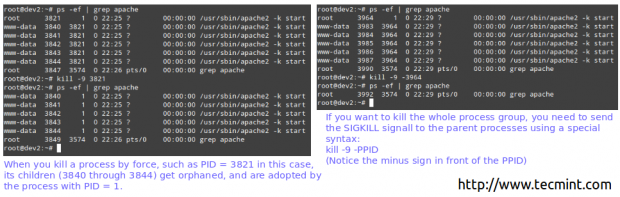
Example 10: Killing by force a process “gone wild”
Please note that each distribution provides tools to gracefully stop / start / restart / reload common services, such as service in SysV-based systems or systemctl in systemd-based systems.
If a process does not respond to those utilities, you can kill it by force by sending it the SIGKILL signal to it.
# ps -ef | grep apache
# kill -9 3821
So.. What Happened / Is Happening?
When there has been any kind of outage in the system (be it a power outage, a hardware failure, a planned or unplanned interruption of a process, or any abnormality at all), the logs in /var/log are your best friends to determine what happened or what could be causing the issues you’re facing.
# cd /var/log
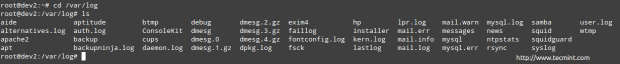
Some of the items in /var/log are regular text files, others are directories, and yet others are compressed files of rotated (historical) logs. You will want to check those with the word error in their name, but inspecting the rest can come in handy as well.
Example 11: Examining logs for errors in processes
Picture this scenario. Your LAN clients are unable to print to network printers. The first step to troubleshoot this situation is going to /var/log/cups directory and see what’s in there.
You can use the tail command to display the last 10 lines of the error_log file, or tail -f error_log for a real-time view of the log.
# cd /var/log/cups
# ls
# tail error_log
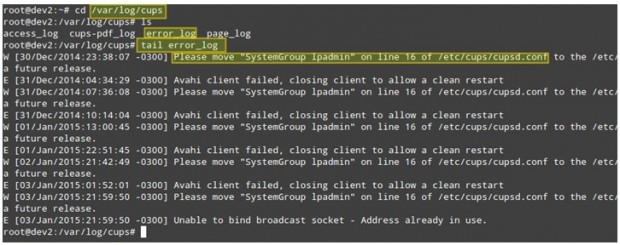
The above screenshot provides some helpful information to understand what could be causing your issue. Note that following the steps or correcting the malfunctioning of the process still may not solve the overall problem, but if you become used right from the start to check on the logs every time a problem arises (be it a local or a network one) you’ll be definitely on the right track.
Example 12: Examining the logs for hardware failures
Although hardware failures can be tricky to troubleshoot, you should check the dmesg and messages logs and grep for related words to a hardware part presumed faulty.
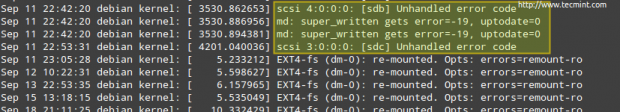
The image below is taken from /var/log/messages after looking for the word error using the following command:
# less /var/log/messages | grep -i error
We can see that we’re having a problem with two storage devices: /dev/sdb and /dev/sdc, which in turn cause an issue with the RAID array.
Conclusion
In this article we have explored some of the tools that can help you to always be aware of your system’s overall status. In addition, you need to make sure that your operating system and installed packages are updated to their latest stable versions. And never, ever, forget to check the logs! Then you will be headed in the right direction to find the definitive solution to any issues.
Feel free to leave your comments, suggestions, or questions -if you have any- using the form below.


It is good post but can you tell the same solution for Linux kali its creating a lot of problems.
also suggest to analysis atop log
Hey, everything about load seems very strange.
0.00 means 0% idle? Should be 100%.
And 0.01 is not 1% overload, it’s 99% idle.
Overload starts at 1.01.
And “less than 0” sounds also weird.
Additionally, this is just true for a sinle CPU system, a 8 core is overloaded starting at 8.01. And if your system is overloaded, that could be a CPU problem, but it could also be an I/O problem. The load is a nice indicator to see if it looks good, but it didn’t help to find out what’s the problem.
@Leo Tilson
You do realize that when you support a client’s server you are not allowed to install third party tools just for your convinience because security issues, recources or just customer policy… What htop? Do you have htop on a red hat server? Of course the typical, old, proven and used in enterprise tools should be described…
@by4,
Thank you for your comment and for your insight. I must confess I hadn’t seen it from that point of view. Best regards.
Most of the commands shown above that produce standard output can be put under one roof to monitor the server behavior. This makes things simpler and keeping an eye on your servers hassle free. There are various such cloud based tools available these days like ServerDensity, Nagios, Zabbix etc. However, my favorite is SeaLion(https://sealion.com) as it is very convenient to install, use and the UI is very pleasing to the eyes. You can add your own commands as well.
Give it a try and see if it works for you.
@Samarth,
Yes, I am familiar with monitoring tools such as the ones you described in your comment. However, those are out of the scope of the LFCE certification. Thanks for your comment.
You have listed all the old favourites, programs that are usually installed by default. Probably worthwhile mentioning a couple of improved versions of some of these programs.
du does much the same as df, but, in my eyes, the output is a little tidier. It defaults to giving a little more information than df – there is a extra column listing file system type.
htop is an improved version of top. It is more customisable and readable.
Both of these programs are widely available. In Debian or clones:
apt-get install di htop.