ps (processes status) is a native Unix/Linux utility for viewing information concerning a selection of running processes on a system: it reads this information from the virtual files in the /proc filesystem. It is one of the important utilities for system administration specifically under process monitoring, to help you understand whats is going on in a Linux system.
It has numerous options for manipulating its output, however, you’ll find a small number of them practically useful for daily usage.
Read Also: All You Need To Know About Processes in Linux [Comprehensive Guide]
In this article, we’ll look at 30 useful examples of ps commands for monitoring active running processes on a Linux system.
Note that ps produces output with a heading line, which represents the meaning of each column of information, you can find the meaning of all the labels on the ps man page.
List All Processes in Current Shell
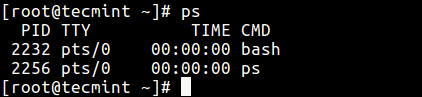
1. If you run the ps command without any arguments, it displays processes for the current shell.
$ ps
Print All Processes in Different Formats
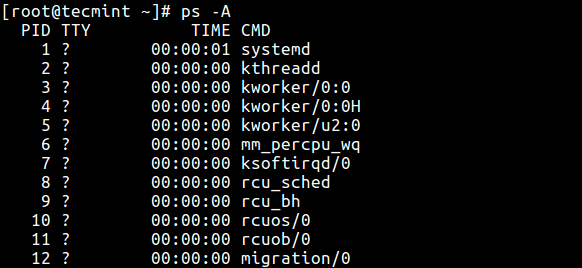
2. Display every active process on a Linux system in generic (Unix/Linux) format.
$ ps -A
OR
$ ps -e
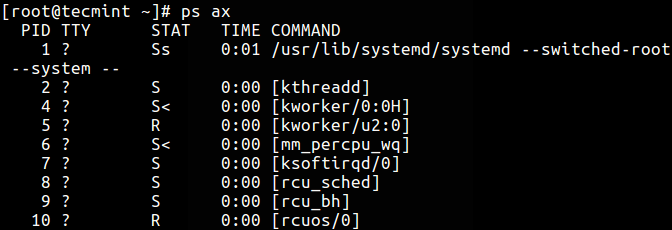
3. Display all processes in BSD format.
$ ps au
OR
$ ps axu
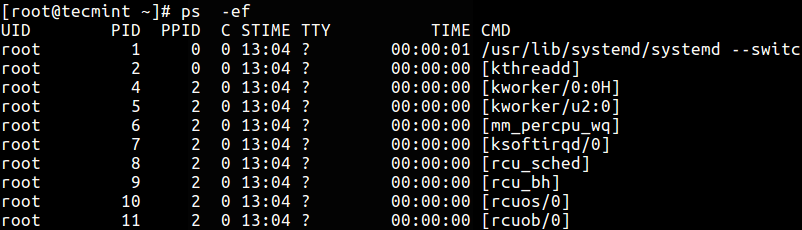
4. To perform a full-format listing, add the -f or -F flag.
$ ps -ef
OR
$ ps -eF
Display User Running Processes
5. You can select all processes owned by you (runner of the ps command, root in this case), type:
$ ps -x
6. To display a user’s processes by real user ID (RUID) or name, use the -U flag.
$ ps -fU tecmint
OR
$ ps -fu 1000
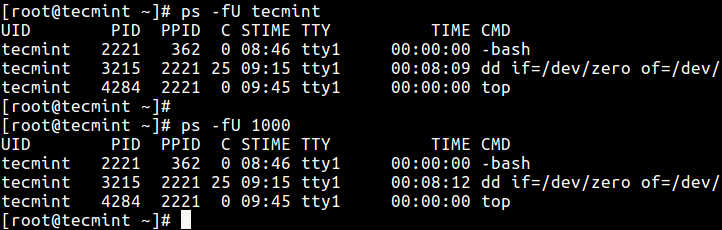
7. To select a user’s processes by effective user ID (EUID) or name, use the -u option.
$ ps -fu tecmint
OR
$ ps -fu 1000
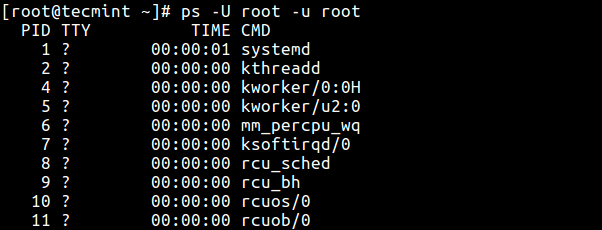
Print All Processes Running as Root (Real and Effective ID)
8. The command below enables you to view every process running with root user privileges (real & effective ID) in user format.
$ ps -U root -u root
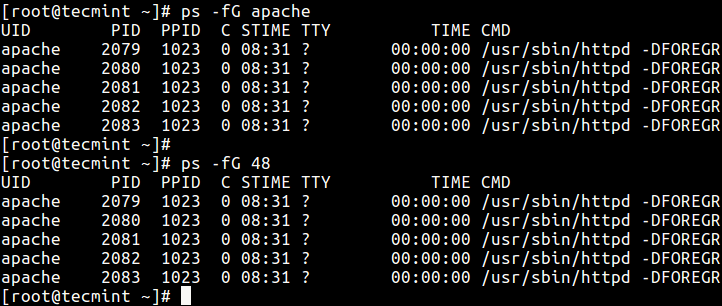
Display Group Processes
9. If you want to list all processes owned by a certain group (real group ID (RGID) or name), type.
$ ps -fG apache
OR
$ ps -fG 48
10. To list all processes owned by effective group name (or session), type.
$ ps -fg apache
Display Processes by PID and PPID
11. You can list processes by PID as follows.
$ ps -fp 1178

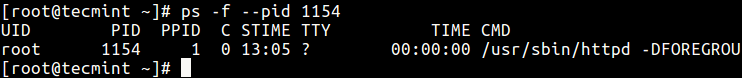
12. To select process by PPID, type.
$ ps -f --ppid 1154
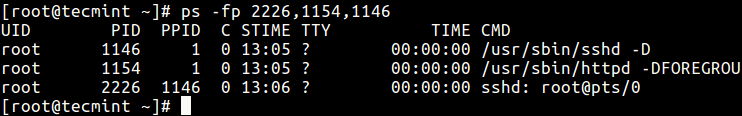
13. Make a selection using a PID list.
$ ps -fp 2226,1154,1146
Display Processes by TTY
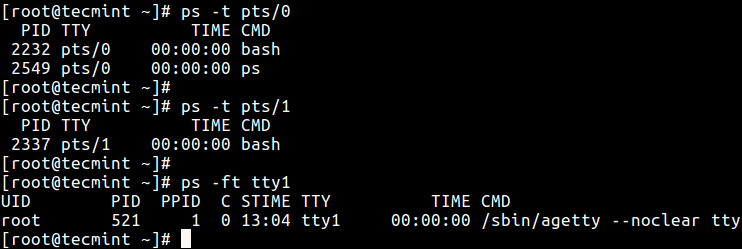
14. To select processes by tty, use the -t flag as follows.
$ ps -t pts/0
$ ps -t pts/1
$ ps -ft tty1
Print Process Tree
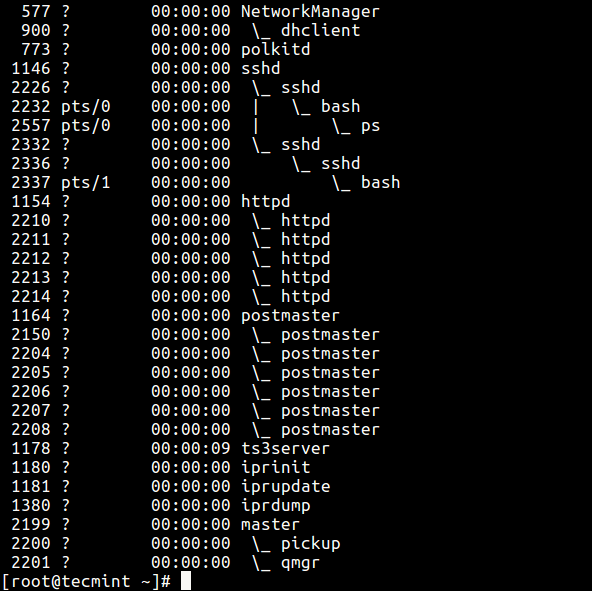
15. A process tree shows how processes on the system are linked to each other; processes whose parents have been killed are adopted by the init (or systemd).
$ ps -e --forest
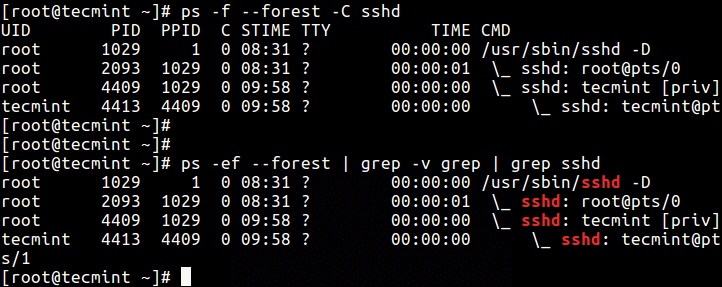
16. You can also print a process tree for a given process like this.
$ ps -f --forest -C sshd
OR
$ ps -ef --forest | grep -v grep | grep sshd
Print Process Threads
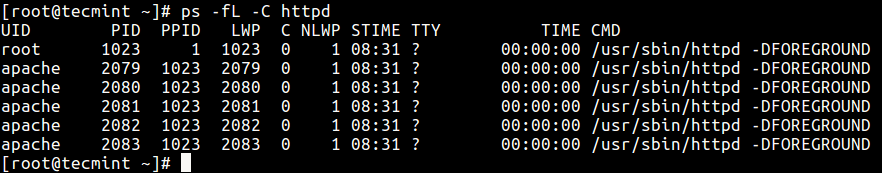
17. To print all threads of a process, use the -L flag, this will show the LWP (lightweight process) as well as NLWP (number of the lightweight processes) columns.
$ ps -fL -C httpd
Specify Custom Output Format
Using the -o or –format options, ps allows you to build user-defined output formats as shown below.
18. To list all format specifiers, include the L flag.
$ ps L
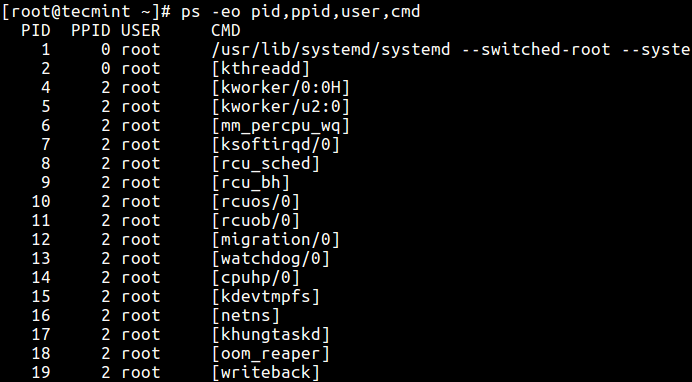
19. The command below allows you to view the PID, PPID, user name, and command of a process.
$ ps -eo pid,ppid,user,cmd
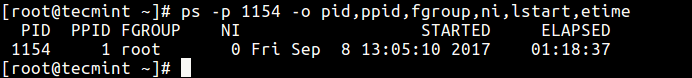
20. Below is another example of a custom output format showing file system group, nice value, start time, and elapsed time of a process.
$ ps -p 1154 -o pid,ppid,fgroup,ni,lstart,etime
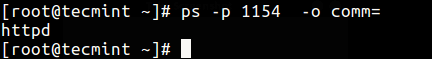
21. To find a process name using its PID.
$ ps -p 1154 -o comm=
Display Parent and Child Processes
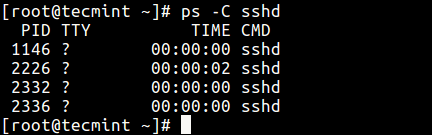
22. To select a specific process by its name, use the -C flag, this will also display all its child processes.
$ ps -C sshd
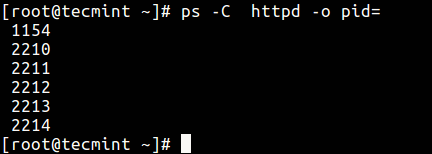
23. Find all PIDs of all instances of a process, useful when writing scripts that need to read PIDs from an std output or file.
$ ps -C httpd -o pid=
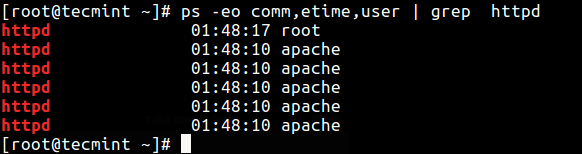
24. Check the execution time of a process.
$ ps -eo comm,etime,user | grep httpd
The output below shows the HTTPD service has been running for 1 hour, 48 minutes, and 17 seconds.
Troubleshoot Linux System Performance
If your system isn’t working as it should be, for instance, if it’s unusually slow, you can perform some system troubleshooting as follows.
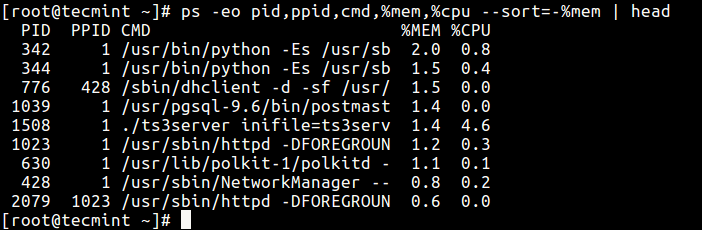
26. Find top running processes by highest memory and CPU usage in Linux.
$ ps -eo pid,ppid,cmd,%mem,%cpu --sort=-%mem | head
OR
$ ps -eo pid,ppid,cmd,%mem,%cpu --sort=-%cpu | head
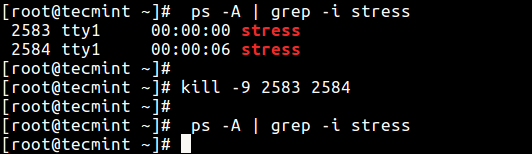
27. To kill Linux processes/unresponsive applications or any process that is consuming high CPU time.
First, find the PID of the unresponsive process or application.
$ ps -A | grep -i stress
Then use the kill command to terminate it immediately.
$ kill -9 2583 2584
Print Security Information
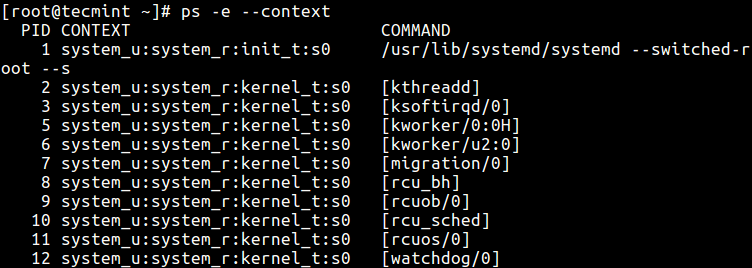
28. Show security context (specifically for SELinux) like this.
$ ps -eM
OR
$ ps --context
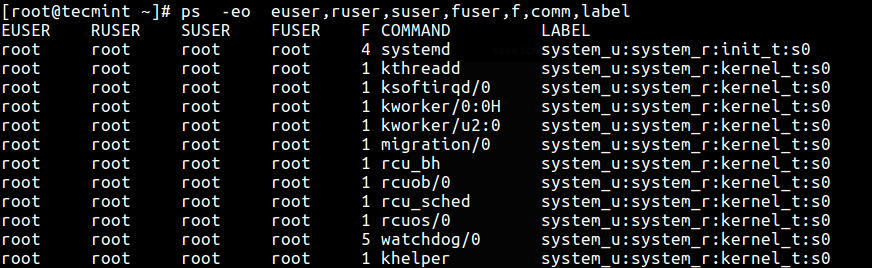
29. You can also display security information in a user-defined format with this command.
$ ps -eo euser,ruser,suser,fuser,f,comm,label
Perform Real-time Process Monitoring Using Watch Utility
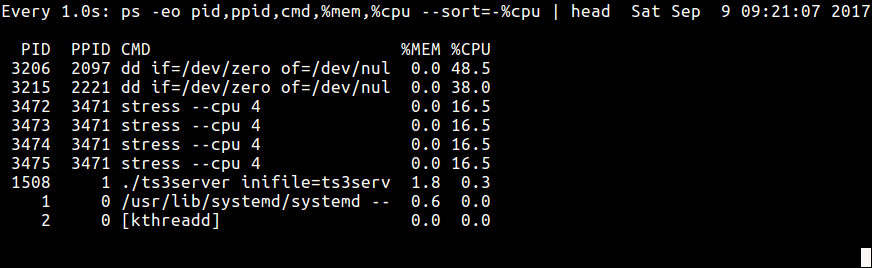
30. Finally, since ps displays static information, you can employ the watch utility to perform real-time process monitoring with repetitive output, displayed after every second as in the command below (specify a custom ps command to achieve your objective).
$ watch -n 1 'ps -eo pid,ppid,cmd,%mem,%cpu --sort=-%mem | head'
Important: ps only shows static information, to view frequently updated output you can use tools such as htop; top, and glances: the last two are in fact Linux system performance monitoring tools.
You might also like to read the following related articles.
- How to Find a Process Name Using PID Number in Linux
- Find Top Running Processes by Highest Memory and CPU Usage in Linux
- A Guide to Kill, Pkill, and Killall Commands to Terminate a Process in Linux
- How to Find and Kill Running Processes in Linux
- How to Start Linux Command in Background and Detach Process in Terminal
That’s all for now. If you have any useful ps command example(s) to share (not forgetting to explain what it does), use the comment form below.


Hello again
Other error “17. To print all threads of a process, use the
-Hflag, this will show the LWP (lightweight process) as well as NLWP (number of lightweight process) columns.” – Must be “-L“.@Manuel,
Thanks, corrected the command in the article…
Excellent tutorial.
About “14. To select processes by tty, use the
-tflag as follows.”The 2 first commands are incorrect, must be “pst” not “pts” (In the screen appears fine)
I really enjoy read and learn from your tutorials
a cold beer for you!
@Manuel,
Thanks again, corrected the commands in the article…
There is an error in the screenshot in “12. To select process by PPID” paragraph.
In the text, you wrote:
But the screenshot contains: “ps -f –pid 1154”, and the process having this PID
@Eric,
Thanks, I will check and corrected the command with screenshot…
I need to access each of the process (pid cannot be used as a unique identity since we need that for a learning procedure) cpu cycle count. And store it in an array or any data structure.Can I have such a C program written.
@suchithra
Yes, you can, look at the documentation of C to find out how to achieve this.
Started to run the process with screen, have a query regarding how to join the process in screen.
@Suswetha
Here is a simple guide to screen: https://www.tecmint.com/screen-command-examples-to-manage-linux-terminals/. I hope this will help you.
Sir, please write article about pgrep command with examples..
@rohit
Okay, we will prepare an article about pgrep. Thanks for following us.