Today, we will delve into the contents of the /proc directory to develop a better understanding of its functionalities. It’s important to note that the /proc directory is a common feature across all Linux distributions, irrespective of their flavor or architecture.
One misconception that we must immediately clarify is that the /proc directory is NOT a conventional file system in the traditional sense of the term.
It is a virtual file system that contains information about processes and other system-related data within the procfs. This file system is mapped to the /proc directory and is mounted during the system’s boot process.
[ez-toc]
What is /proc in Linux
The /proc file system serves as an interface to kernel data structures and runtime information, which provides a way for both users and applications to access detailed information about processes, system configuration, hardware, and more, by exposing this data through a hierarchy of virtual files.
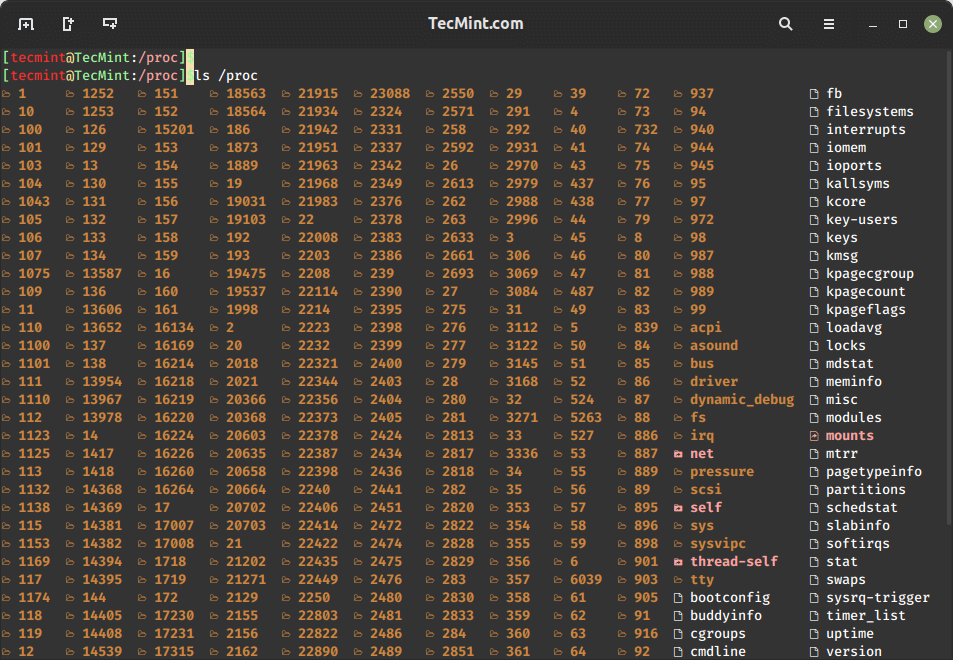
To view a complete list of files and directories in the /proc file system, you can use the ls command as shown.
$ ls /proc
Navigating /proc in Linux
When you navigate to the /proc directory, you will notice that there are some familiar-sounding files, and then a whole bunch of numbered directories, each corresponding to a running process on the system.
$ cd /proc
$ ls
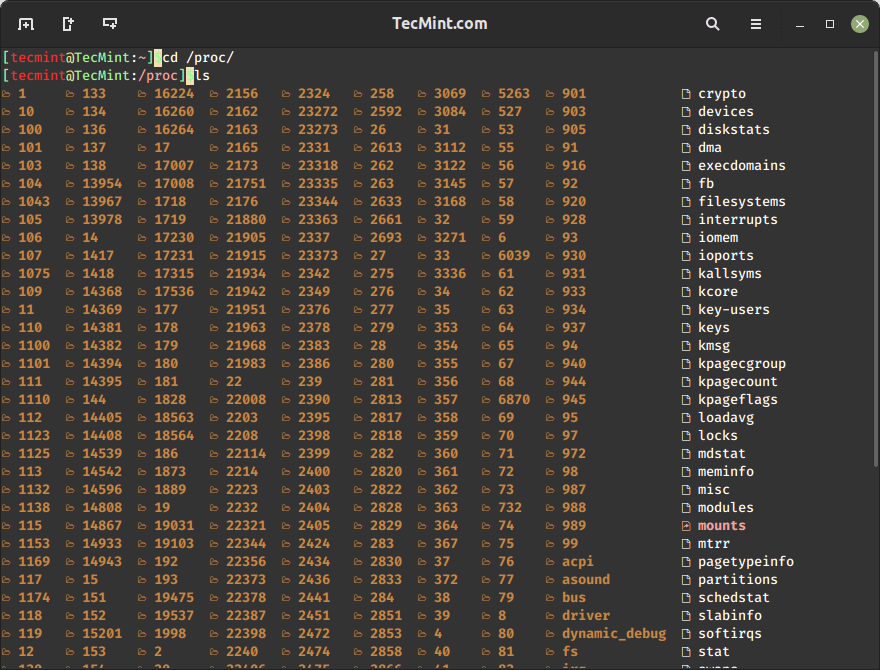
These numbered directories represent the processes, better known as process IDs (PIDs), and within them, a command that occupies them. The files contain system information such as memory (meminfo), CPU information (cpuinfo), and available filesystems.
Here are a few key files and directories you’ll encounter:
/proc/cpuinfo– List information about the CPU(s) on the system, such as the model, speed, and number of cores../proc/meminfo– List details about memory usage and statistics that contain the total amount of memory, free memory, and the memory used by each process./proc/filesystems– Contains a list of all the filesystems that are supported by the kernel./proc/sys– List configuration and runtime parameters for the kernel./proc/loadavg– Show system load average over different time intervals such as 1, 5, and 15 minutes./proc/self– A symbolic link to the process’s own directory./proc/stat– Contains a variety of statistics about the system, such as the number of processes running, the number of interrupts, and the amount of time spent in each CPU state./proc/uptime– Contains the amount of time the system has been running./proc/PID– Contains information about a specific process, where PID is the process ID.
Extracting System Information
The /proc/meminfo is used to show information about the memory usage and statistics of a Linux system, which contains a snapshot of various memory-related metrics, which can be useful for monitoring system performance and resource utilization.
$ cat /proc/meminfo
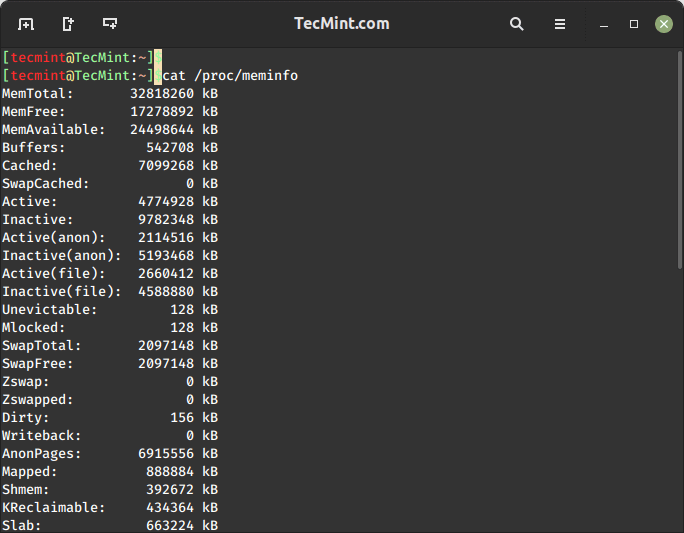
As you can see, /proc/meminfo contains a bunch of information about your system’s memory, including the total amount available (in kb) and the amount free on the top two lines.
Running the cat command on any of the files in /proc will output their contents. Information about any files is available in the man page by running:
$ man 5 /proc/<filename>
I will give you a quick rundown on /proc’s files:
- /proc/cmdline – Kernel command line information.
- /proc/console – Information about current consoles including tty.
- /proc/devices – Device drivers currently configured for the running kernel.
- /proc/dma – Info about current DMA channels.
- /proc/fb – Framebuffer devices.
- /proc/filesystems – Current filesystems supported by the kernel.
- /proc/iomem – Current system memory map for devices.
- /proc/ioports – Registered port regions for input-output communication with the device.
- /proc/loadavg – System load average.
- /proc/locks – Files currently locked by kernel.
- /proc/meminfo – Info about system memory (see above example).
- /proc/misc – Miscellaneous drivers registered for the miscellaneous major devices.
- /proc/modules – Currently loaded kernel modules.
- /proc/mounts – List of all mounts in use by the system.
- /proc/partitions – Detailed info about partitions available to the system.
- /proc/pci – Information about every PCI device.
- /proc/stat – Record or various statistics kept from the last reboot.
- /proc/swap – Information about swap space.
- /proc/uptime – Uptime information (in seconds).
- /proc/version – Kernel version, gcc version, and Linux distribution installed.
Extracting Process Information
Within /proc’s numbered directories you will find a few files and links. Remember that these directories’ numbers correlate to the PID of the command being run within them.
For example, navigating to /proc/<PID> provides details such as:
/proc/<PID>/cmdline– Command-line arguments used to start the process./proc/<PID>/status– Detailed status information, including memory usage and process statistics./proc/<PID>/fd– Symbolic links to files opened by the process.
Let’s use an example to view a folder called /proc/12.
$ cd /proc/12
$ ls
If I run:
$ cat /proc/12/status
I get the following:
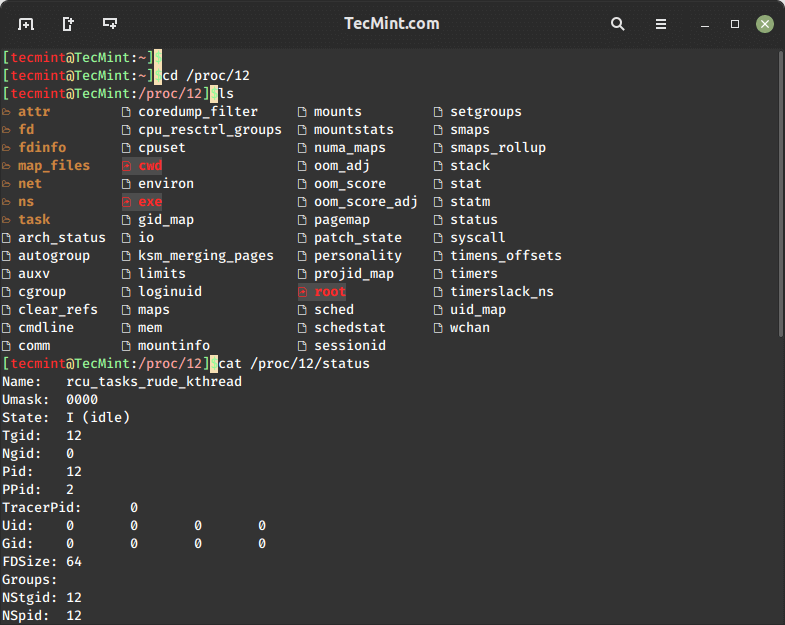
So, what does this mean? Well, the important part is at the top. We can see from the status file that this process belongs to rcu_tasks_rude_kthread. Its current state is idle, and its process ID is 12, obviously.
We also can see who is running this, as UID and GID are 0, indicating that this process belongs to the root user.
In any numbered directory, you will have a similar file structure, and the most important ones with their descriptions, are as follows:
- cmdline – command line of the process
- environ – environmental variables
- fd – file descriptors
- limits – contains information about the limits of the process
- mounts – related information
You will also notice several links in the numbered directory:
- cwd – a link to the current working directory of the process
- exe – link to the executable of the process
- root – link to the work directory of the process
This should get you started with familiarizing yourself with the /proc directory. It should also provide insight into how a number of commands obtain their info, such as uptime, lsof, mount, and ps, just to name a few.


The
/procdirectory has 0kb files but there are some files that have some size what are those files?@Situn,
In the Linux /proc directory, you’ll encounter a mix of files with different sizes including files with 0KB size. However, this doesn’t mean they are empty or lack content, but they are often used as interfaces to kernel data structures, configurations, or real-time information.
Minor issue – it’s
/proc/consoles(with an s at the end).Also you might want to add mention of
/proc/selfand why this happens:Thanks for the info sir.. very much appreciated
Depending on what type of hardware you have, you can get a lot of information in some of the
/procfiles. Since you were asking specifically about your video card, you can run:If it is using an ISA slot, you can run the following:
If you are looking for your hard drive info:
The man page of
/proc/will give you plenty of info about any file in the/procdirectory.Of course, there are easier ways to obtain this information, and utilities that are much more script-friendly. lshw is the first:
There is also hwinfo:
And the very script-friendly lsblk:
All three of those utilities are available through apt or yum.
Hi
Just a question, what file in /proc will I know the brand of my hard disk? memory video card? is it all located in /proc?
thanks