bmon is a simple yet powerful, text-based network monitoring and debugging tool for Unix-like systems, which captures networking related statistics and displays them visually in a human friendly format. It is a reliable and effective real-time bandwidth monitor and rate estimator.
It can read input using an assortment of input modules and presents output in various output modes, including an interactive curses user interface as well as a programmable text output for scripting purposes.
Suggested Read: 20 Command Line Tools to Monitor Linux Performance
Install bmon Bandwidth Monitoring Tool in Linux
Almost all Linux distributions has bmon package in the default repositories and can be easily install from default package manger, but the available version might be little older.
$ sudo yum install bmon      [On RHEL/CentOS/Fedora]
$ sudo dnf install bmon      [On Fedora 22+]
$ sudo apt-get install bmon  [On Debian/Ubuntu/Mint]
Alternatively, you can get .rpm and .deb packages for your Linux distribution from https://pkgs.org/download/bmon.
If you wanted to have a most recent version of bmon (i.e version 4.0), you need to build it from source using following commands.
On CentOS, RHEL and Fedora
$ git clone https://github.com/tgraf/bmon.git
$ cd bmon
$ sudo yum install make libconfuse-devel libnl3-devel libnl-route3-devel ncurses-devel
$ sudo ./autogen.sh
$ sudo./configure
$ sudo make
$ sudo make install
On Debian, Ubuntu and Linux Mint
$ git clone https://github.com/tgraf/bmon.git
$ cd bmon
$ sudo apt-get install build-essential make libconfuse-dev libnl-3-dev libnl-route-3-dev libncurses-dev pkg-config dh-autoreconf
$ sudo ./autogen.sh
$ sudo ./configure
$ sudo make
$ sudo make install
How to Use bmon Bandwidth Monitoring Tool in Linux
Run it as below (for starters: RX means received bytes per second and TX refers to transmitted bytes per second):
$ bmon
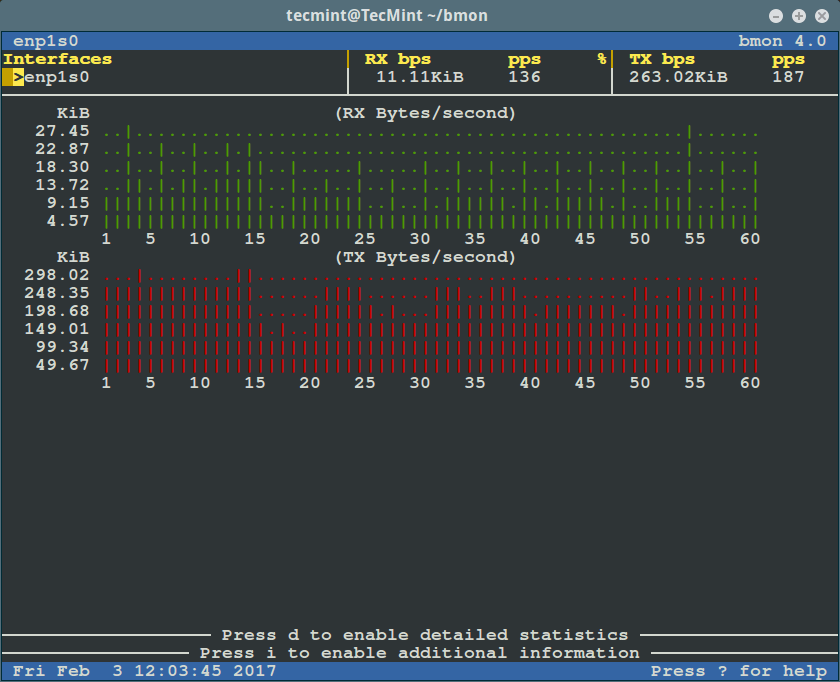
To view more detailed graphical statistics/information of bandwidth usage, press d key and refer screnshot below.
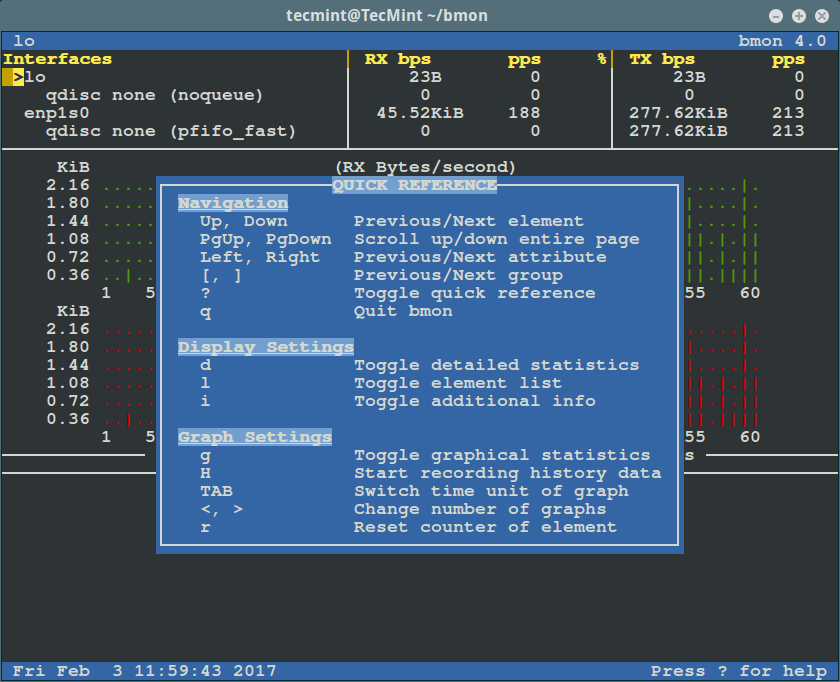
Press [Shift + ?] to view the quick reference below. To exit the interface, press [Shift + ?] again.
To view statistics of a given interface, select it using the Up and Down arrows. However, to monitor a specific interface only, specify it as an argument on the command line as follows.
Suggested Read: 13 Tools to Monitor Linux Performance
The flag -p sets a policy defining which network interfaces to display, in the example below, we will be monitoring the enp1s0 network interface:
$ bmon -p enp1s0
To use bit per second instead of bytes per second, use the -b flag like so:
$ bmon -bp enp1s0
We can also define the intervals per second with the -r flag as follows:
$ bmon -r 5 -p enp1s0
How to Use bmon Input Modules
bmon has a number of input modules that offer statistical data about interfaces, which includes:
- netlink – employs the Netlink protocol to collect interface and traffic control statistics from the kernel. This is the default input module.
- proc — reads interface statistics from the /proc/net/dev file. It is considered a legacy interface and offered for backwards compatibly. It is a fallback module in case the Netlink interface is not available.
- dummy – this is a programmable input module for debugging and testing purposes.
- null – disables data collection.
To find additional info about a module, invoke the it with the “help” option set as follows:
$ bmon -i netlink:help
The next command will invoke bmon with the proc input module enabled:
$ bmon -i proc -p enp1s0
How to Use bmon Output Modules
bmon also uses output modules to display or export the statistical data collected by the input modules above, which includes:
- curses – this is an interactive curses based text user interface, it offers real time rate estimations and a graphical representation of each attribute. It is the default output mode.
- ascii – is a straightforward programmable text output meant for human consumption. It can display list of interfaces, detailed counters and graphs to the console. It is the default fallback output mode when curses is not available.
- format – is a fully scriptable output mode, it’s meant for consumption by other programs-meaning we can use its output values at a later time in scripts or programs for analysis and more.
- null – this disables output.
To get more info concerning a module, run the it with the “help” flag set like so:
$ bmon -o curses:help
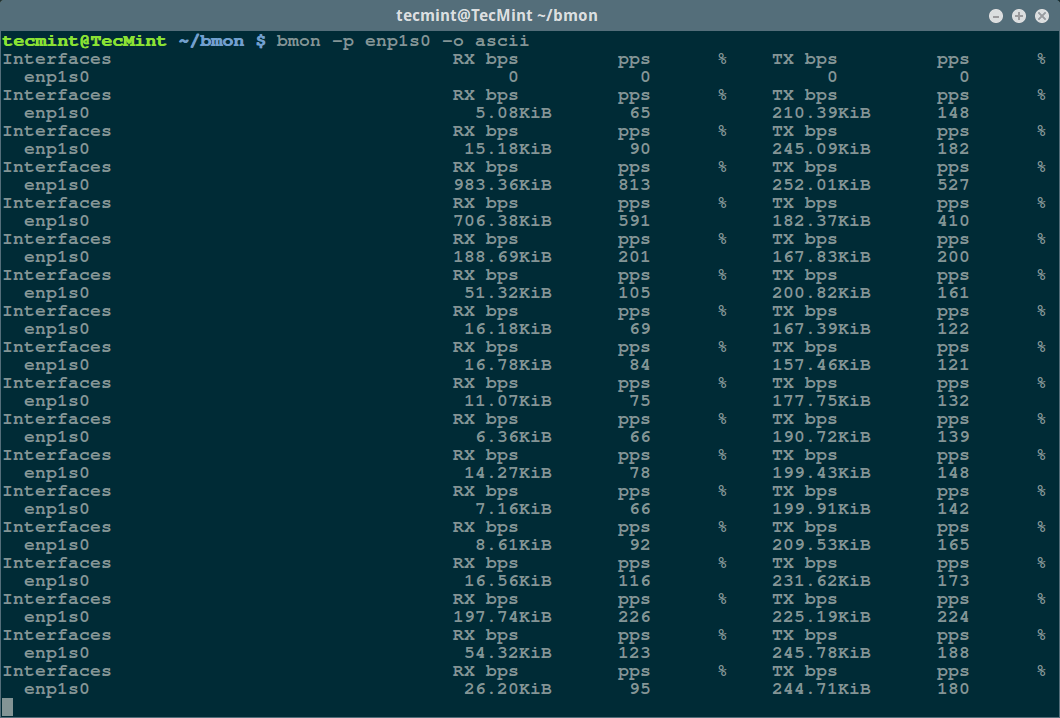
The command that follows will invoke bmon in ascii output mode:
$ bmon -p enp1s0 -o ascii
We can run the format output module as well, then use the values obtained for scripting or in another program:
$ bmon -p enp1s0 -o format

For additional usage info, options and examples, read the bmon man page:
$ man bmon
Visit the bmon Github repository: https://github.com/tgraf/bmon.
That’s all for now, test the various features of bmon in different scenarios and share your thoughts about it with us via the comment section below.


Hi is there any way I can embed or view it as html/php via web browser instead of viewing it on the terminal of Linux? Thank you for your answers…
This tool seems to be very good! The only thing i find strange is that the detailed view seems to only show IPv6 stats (there’s only IP6 in the detailed list). Where is IPv4 (main event here!!) ? Checked man pages, googled around to no avail. I’m using Ubuntu 18.04.
@Guy
Thanks for sharing your concern with us, you can post this question to the developer at: https://github.com/tgraf/bmon for more information.
Hi,
I am facing issues about nagios users for viewing particular host and services. please help me how i can create user in nagios core and dedicate host to that user
@harish
Follow the steps below:
1- Start by creating new contact definitions for your client, for example: contact_name user1.
2- Then create contact groups or you can add the new contact for you existing group, depending on the checks that you want to permit.
3- Closely use the new Contact Group with customers email and your main admin. Note you can either use existing Host Groups or create new HostGroups if you choose to.
4- Finally, add htaccess user to your htpasswd file (htpasswd.users), it important that the username matches the name on your Contact(user1).
Hope this gives your a rough idea of what to do.
I got a lot of errors when installing on centos. I got my error fixed installing this missing packages:
@batchen
Many thanks for the feedback, this will be so useful to other CentOS users.