Centralized logging, just like security, is a fundamental aspect of monitoring and sound management of core resources in an IT infrastructure including web applications and hardware devices.
Competent operation teams always have in place a log monitoring and management system which proves beneficial especially when there’s a system failure or an application behaves weirdly.
Why is Logging So Important?
When systems crash or applications malfunction, as they will sometimes do, you need to get to the bottom of the matter and uncover the cause of failure.
Log files record system activity and give insights into the possible sources of error and subsequent failure. They give an elaborate sequence of events, including a detailed timestamp, that occasioned or led to an incident.
The diagnosis and recovery of any system start with the review of system logs. Analyzing log files can help operation teams find evidence of suspicious activity such as unauthorized logins which points to a security breach.
It can help database administrators to tune their database for optimal performance and also help developers troubleshoot issues with their applications and write better code.
Centralized Logging
Managing and analyzing log files from one or two servers might be an easy undertaking. The same cannot be said of an enterprise environment with dozens of servers.
For this reason, centralized logging is most recommended. Centralized logging consolidates log files from all systems into one dedicated server for easy log management. It saves time and energy that would have been used in logging in and analyzing log files of individual systems.
In this guide, we feature some of the most notable open-source centralized logging management systems for Linux.
[ez-toc]
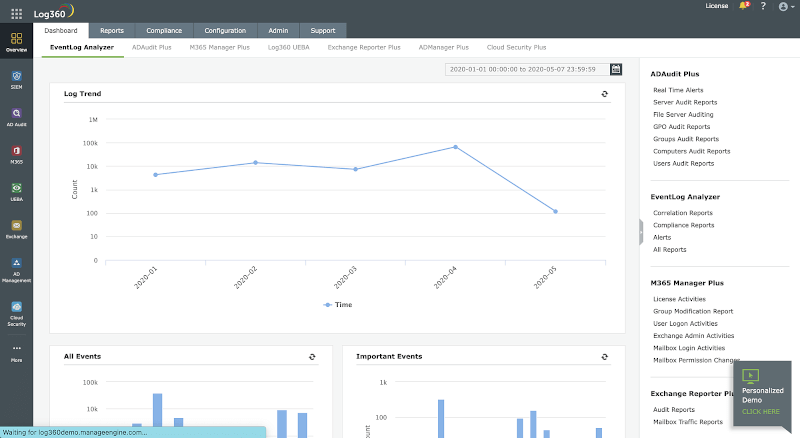
1. ManageEngine Log360
ManageEngine Log360 is an SIEM or security analytics solution that helps you combat threats on-premises, in the cloud, or in a hybrid environment.
It also helps organizations adhere to compliance mandates such as PCI DSS, HIPAA, GDPR, and more. You can customize the solution to cater to your unique use cases and protect your sensitive data.
With Log360, you can monitor and audit activities that occur in your Active Directory, network devices, employee workstations, file servers, databases, Microsoft 365 environment, cloud services, and more.
Log360 correlates log data from different devices to detect complex attack patterns and advanced persistent threats. The solution also comes with machine learning-based behavioral analytics that detects user and entity behavior anomalies and couples them with a risk score.
The security analytics are presented in the form of more than 1000 pre-defined, actionable reports. Log forensics can be performed to get to the root cause of a security challenge.
The built-in incident management system allows you to automate the remediation response with intelligent workflows and integrations with popular ticketing tools.
The solution can be installed on-premises and is also available on the cloud as Log360 Cloud. Support is offered via phone, email, and other online resources.
Here’s what Log360 can do for you:
- Identify malicious communications with blacklisted IPs, URLs, and domains by corroborating data from threat intelligence services.
- Monitor widely used public cloud platforms, including Amazon Web Services (AWS), Microsoft Azure, and Salesforce.
- Monitor file and folder creation, deletion, modification, and permission changes in Windows file servers, NetApp file servers, EMC file servers, Linux, and more.
- Monitor and audit critical Active Directory changes in real time.
2. Elastic Stack ( Elasticsearch Logstash & Kibana)
Elastic Stack, commonly abbreviated as ELK, is a popular three-in-one log centralization, parsing, and visualization tool that centralizes large sets of data and logs from multiple servers into one server.
ELK stack comprises 3 different products:
Logstash
Logstash is a free and open-source data pipeline that collects logs and events data and even processes and transforms the data to the desired output. Data is sent to logstash from remote servers using agents called ‘beats’.
The ‘beats’ ship a huge volume of system metrics and logs to Logstash whereupon they are processed. It then feeds the data to Elasticsearch.
Elasticsearch
Built on Apache Lucene, Elasticsearch is an open-source and distributed search and analytics engine for nearly all types of data – both structured and unstructured. This includes textual, numerical, and geospatial data.
It was first released in 2010. Elasticsearch is the central component of the ELK stack and is renowned for its speed, scalability, and REST APIs. It stores, indexes, and analyzes huge volumes of data passed on from Logstash.
Kibana
Data is finally passed on to Kibana, which is a WebUI visualization platform that runs alongside Elasticsearch. Kibana allows you to explore and visualize time-series data and logs from elasticsearch.
It visualizes data and logs on intuitive dashboards which take various forms such as bar graphs, pie charts, histograms, etc.
3. Graylog
Graylog is yet another popular and powerful centralized log management tool that comes with both open-source and enterprise plans. It accepts data from clients installed on multiple nodes and, just like Kibana, visualizes the data on dashboards on a web interface.
Graylogs plays a monumental role in making business decisions touching on user interaction of a web application. It collects vital analytics on the apps’ behavior and visualizes the data on various graphs such as bar graphs, pie charts, and histograms to mention a few. The data collected inform key business decisions.
For example, you can determine peak hours when customers place orders using your web application. With such insights in hand, the management can make informed business decisions to scale up revenue.
Unlike Elastic Search, Graylog offers a single-application solution for data collection, parsing, and visualization. It rids the need for installation of multiple components unlike in ELK stack where you have to install individual components separately. Graylog collects and stores data in MongoDB which is then visualized on user-friendly and intuitive dashboards.
Graylog is widely used by developers in different phases of app deployment in tracking the state of web applications and obtaining information such as request times, errors, etc. This helps them to modify the code and boost performance.
4. Fluentd
Written in C, Fluentd is a cross-platform and open-source log monitoring tool that unifies logs and data collection from multiple data sources. It’s completely open source and licensed under the Apache 2.0 license. In addition, there’s a subscription model for enterprise use.
Fluentd processes both structured and semi-structured sets of data. It analyzes application logs, events logs, and clickstreams and aims to be a unifying layer between log inputs and outputs of varying types.
It structures data in a JSON format allowing it to seamlessly unify all facets of data logging including the collection, filtering, parsing, and outputting of logs across multiple nodes.
Fluentd comes with a small footprint and is resource-friendly, so you won’t have to worry about running out of memory or your CPU being overutilized.
Additionally, it boasts of a flexible plugin architecture where users can take advantage of over 500 community-developed plugins to extend its functionality.
5. LOGalyze
LOGalyze is a powerful network monitoring and logs management tool that collects and parses logs from network devices, Linux, and Windows hosts. It was initially commercial but is now completely free to download and install without any limitations.
LOGalyze is ideal for analyzing server and application logs and presents them in various report formats such as PDF, CSV, and HTML. It also provides extensive search capabilities and real-time event detection of services across multiple nodes.
Like the aforementioned log monitoring tools, LOGalyze also provides a neat and simple web interface that allows users to log in and monitor various data sources, and analyze log files.
6. NXlog
NXlog is yet another powerful and versatile tool for log collection and centralization. It’s a multi-platform log management utility that is tailored to pick up policy breaches, identify security risks, and analyze issues in system, application, and server logs.
NXlog has the capability of collating events logs from numerous endpoints in varying formats including Syslog and Windows event logs. It can perform a range of log-related tasks such as log rotation and log rewrites. log compression and can also be configured to send alerts.
You can download NXlog in two editions: The community edition, which is free to download, and use, and the enterprise edition which is subscription-based.
Graylog collects and stores data in MongoDB” – are you sure?
I think Graylog keeps its configuration in mongo, but stores data in elasticsearch
You forgot to mention Telegraf, Influxdb, and Grafana as a sixth solution and Zabbix as the seventh solution.
@Sysadmin,
Thanks for informing us about these tools, will surely include them in the list as suggested…