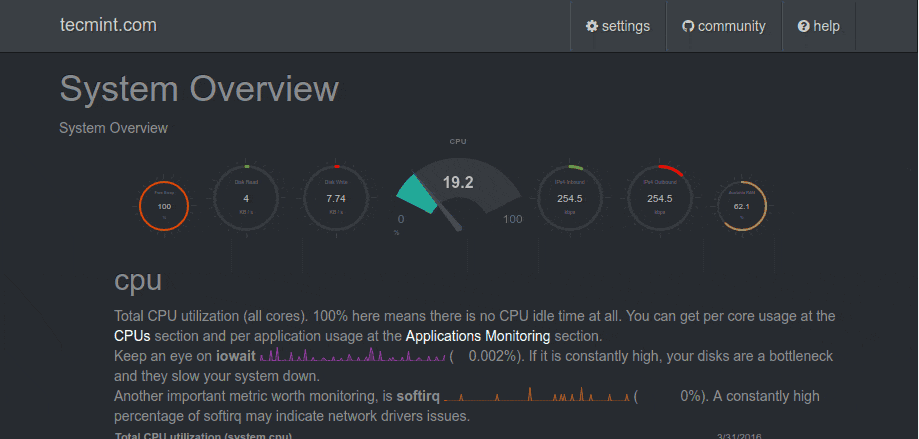
netdata is a extremely optimized Linux utility that provides real-time (per second) performance monitoring for Linux systems, applications, SNMP devices, etc. and shows full interactive charts that absolutely render all collected values over the web browser to analyze them.
Don’t Miss: 20 Useful Command-line Tools to Monitor Linux Performance
It has been developed to be installed on each Linux system, without interrupting the current running applications on it. You can use this tool to monitor and get overview of what is happening in real-time and what just happened, on your Linux systems and applications.
This is what it monitors:
- Total and Per Core CPU usage, interrupts, softirqs and frequency.
- Total Memory, RAM, Swap and Kernel usage.
- Disk I/O (per disk: bandwidth, operations, backlog, utilization, etc).
- Monitors Network interfaces including: bandwidth, packets, errors, drops, etc).
- Monitors Netfilter / iptables Linux firewall connections, events, errors, etc.
- Processes (running, blocked, forks, active, etc).
- System Applications with the process tree (CPU, memory, swap, disk reads/writes, threads, etc).
- Apache and Nginx Status monitoring with mod_status.
- MySQL database monitoring: queries, updates, locks, issues, threads, etc.
- Postfix email server message queue.
- Squid proxy server bandwidth and requests monitoring.
- Hardware sensors (temperature, voltage, fans, power, humidity, etc).
- SNMP devices.
netdata Installation on Linux Systems
The latest release of netdata can be easily installed on Arch Linux, Gentoo Linux, Solus Linux and Alpine Linux using your package manager as shown.
$ sudo pacman -S netdata         [Install Netdata on Arch Linux]
$ sudo emerge --ask netdata      [Install Netdata on Gentoo Linux]
$ sudo eopkg install netdata     [Install Netdata on Solus Linux]
$ sudo apk add netdata           [Install Netdata on Alpine Linux]
On Debian/Ubuntu and RHEL/CentOS/Fedora, there is one line installation script that will install latest netdata and also keep it up to date automatically.
$ bash <(curl -Ss https://my-netdata.io/kickstart.sh            [On 32-bit]
$ bash <(curl -Ss https://my-netdata.io/kickstart-static64.sh)  [On 64-bit]
The above script will:
- discover the distribution and installs the needed software packages for building netdata (will ask for confirmation).
- downloads the latest netdata source tree to /usr/src/netdata.git.
- installs netdata by executing
./netdata-installer.shfrom the source tree. - installs
netdata-updater.shto cron.daily, so your netdata will be updated daily (you will receive a alert from cron only if the update fails).
Note: The kickstart.sh script progress all its parameters to netdata-installer.sh, so you can define more parameters to modify the installation source, enable/disable plugins, etc.
Alternatively, you can also install latest netdata manually by cloning its repository, but before you start installing netdata, make sure you have these basic build environment packages installed on the system, if not install it using your respective distribution package manager as shown:
On Debian / Ubuntu
# apt-get install zlib1g-dev gcc make git autoconf autogen automake pkg-config
On Centos / Redhat / Fedora
# yum install zlib-devel gcc make git autoconf autogen automake pkgconfig
Next, clone the netdata repository from git and run netdata installer script to build it.
# git clone https://github.com/firehol/netdata.git --depth=1
# cd netdata
# ./netdata-installer.sh
Note: The netdata-installer.sh script will build netdata and install it on your Linux system.
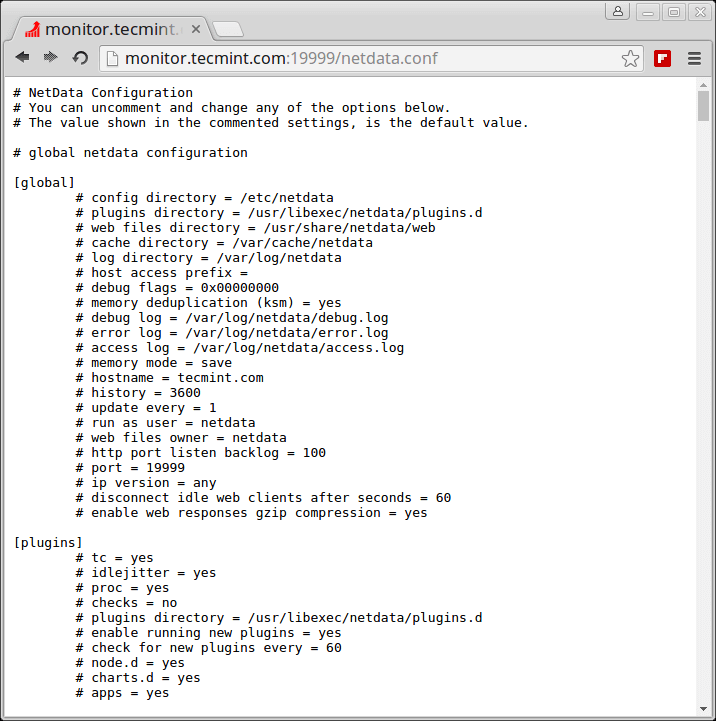
Once the netdata installer finishes, the file /etc/netdata/netdata.conf will be created in your system.
Now it’s time to start netdata by executing the following command from the terminal.
# /usr/sbin/netdata
You can also stop netdata by terminating it’s process with killall command as shown.
# killall netdata
Note: Netdata saves on exit its round robbin database information under /var/cache/netdata file, so that when you start again netdata, it will continue from where it was stopped last time.
Starting and Testing netdata
Now open your browser and navigate to the following address to access the web site for all graphs:
# http://127.0.0.1:19999/
Check out the video that shows how Real-time Linux performance monitoring done here: https://www.youtube.com/watch?v=QIZXS8A4BvI
You can also view the running configuration of netdata at any time, by going to:
http://127.0.0.1:19999/netdata.conf
Updating netdata
You can update netdata daemon to the most recent version by going into netdata.git directory you downloaded before and running:
# cd /path/to/netdata.git
# git pull
# ./netdata-installer.sh
The above netdata installer script will build new version and restart netdata.
Reference: https://github.com/firehol/netdata/


Netdata currently has many of the default collectors disabled as they are switching over from Python-based collectors to GO based. There are some additional steps needed right now to get monitoring working for things like NGINX, php-fpm, and Mysql.
Hi All,
How can we add apache web server on netdata .Can you explain ?
Hi,
What I’d like to do is to be able to take the data (/var/cache/netdata/*) and have it move before it gets purged. I don’t want to keep it on the system as it gets to be too much and Id like to have the historical trending.
In the docs above it says round robbin data but I tried using rrdtool on the dbs and it says they are not rrd databases. Any ideas on what I can do for this?
Got Netdata installed on a server that REALLY needed it.
I am loving this. THANKS
http://linux-hostname:19999 is what I mean.
Hello Ravi,
Good post. I installed on a RedHat Linux server. When I start the service, I see the following message.
2017-02-22 10:41:38: netdata: ERROR: IPv6 socket() on ip ‘::’ port 19999 failed. (errno 97, Address family not supported by protocol)
2017-02-22 10:41:38: netdata: ERROR: Cannot bind to ip ‘::’, port 19999
2017-02-22 10:41:38: netdata: INFO: Listen socket [0.0.0.0]:19999 opened.
I cannot connect from a browser when I tried http://linux-hostname:1999
Can you please suggest?
@Shashi,
It seems that it couldn’t bind on IPv6 port due to firewall restrictions, I suggest you to check your firewall rules and open port 19999 on firewall or open it for IPv4.
You can verify the port by running netstat command.
Hi Ravi,
I am trying this on a sandbox environment and asking the networking team for firewall rules change would be quite challenging and time consuming.
Is there a way I can find:
1) an open port that’s not blocked by the firewall and
2) change the default 19999 port to a different one?
Thanks
Do you know if this app can monitor other machines of which its not installed on? Also this would be cool to integrate into ddwrt.
@David,
Unfortunately, Netdata application is not designed to monitor remote Linux machines and nor its possible to integrate it with any other tool..
When I try to install on RHEL 7 it shows the following error ,
” Sorry! NetData failed to build…
You may need to check these:
1. The package uuid-dev (or libuuid-devel) has to be installed.
If your system cannot find libuuid, although it is installed
run me with the option: –libs-are-really-here
2. The package zlib1g-dev (or zlib-devel) has to be installed.
If your system cannot find zlib, although it is installed
run me with the option: –libs-are-really-here
3. You need basic build tools installed, like:
gcc make autoconf automake pkg-config
Autoconf version 2.60 or higher is required.
If you still cannot get it to build, ask for help at github:
https://github.com/firehol/netdata/issues ”
What can I do now?
@Narayan,
Please find install the missing dependency packages as shown in the article, before installing Netdata tool, here is the command to install those missing packages.
@Narayan, 1st run yum install libuuid-devel
then yum install zlib-devel
and then run installer with following command
./netdata-installer.sh –libs-are-really-here
Hope this will solve your issue.
Thanks
On mine this was missing ( libuuid-devel )
See if thats what you need
Hello Ravi,
Thanks for the tutorial. I have installed it on 3 different servers. 1 of them is showing Firewall (Netfilter) data but other 2 are not showing this option. I have repeated the same steps on all servers. Can you please guide how to enable firewall plugin on other 2 servers?
Thanks
@Umar,
On the other servers, the firewall service is running? could you share the screenshots of other servers? so that we check and provide you a solution..
on raspbian, i also need to install uuid-dev.
it works pretty well…
Will try this tool…
Hi,
I`ve got problem to install on Debian 8
log:
checking for UUID… no
configure: error: Package requirements (uuid) were not met:
No package ‘uuid’ found
Consider adjusting the PKG_CONFIG_PATH environment variable if you
installed software in a non-standard prefix.
Alternatively, you may set the environment variables UUID_CFLAGS
and UUID_LIBS to avoid the need to call pkg-config.
See the pkg-config man page for more details.
If you have any idea please help!
thanks in advance
@Petru,
Install
libuuidpackage using apt-get package manager to get rid out of such error.Is it okay to install Netdata on a running LAMP server? I mean is it something like webmin, where you have to install before everything?
@Sourav,
Yes, its okay to install Netdata monitoring tool on LAMP setup or any application setup, as its runs on different port so no issues at all.
You can install netdata in /opt/ . It runs on 19999 port, so if you are not running another app in that port, then will be ok.
Thanks a lot it is a great tool.
There is a problem in here you should install uuid-dev for the install script to work correctly.
This thing is insanely cool. Can’t believe how easy install was. I can even monitor the app remotely on a winblows machine ! I must have screwed something up. Works too well. I am blown away by the app. KUDOS!
# /usr/sbin/netdata
I got some errors as executing the before-mentioned command.
[root@ip-10-0-7-128 ~]# /usr/sbin/netdata
16-04-04 07:58:19: ERROR: netdata: IPv6 bind() failed. (errno 98, Address already in use)
16-04-04 07:58:19: ERROR: netdata: IPv4 bind() failed. (errno 98, Address already in use)
16-04-04 07:58:19: FATAL: netdata: Cannot listen socket. # : Success
@Khoi,
It seems that the port 19999, which is used by netdata monitoring tool was already using by some other application, try to use different port for netdata while executing like:
Hi…
Not found available port… how can find one?
I try with others but always send same error.
Tanks.
@Miguel,
Use netstat command to find all listening ports and then assign unused port the netdata daemon..
Could I ask you to please break this down into steps for a noob? Thanks.
@Bill,
It’s already covered in step-by-step mode, by keeping the newbies in mind, let me know where you facing problems?
Thanks for the great article. Just FYI, the package for Debian/Ubuntu is zlib1g-dev (it is 1 (one) there.)
There are agents if I want to monitor another hosts?
@Rafael,
Unfortunately, there isn’t any agents to monitor other Linux hosts, it’s agent-less tool works on only single machine..
They support SNMP, according to their README.
But anyway – for “real” multi-machine monitoring and alerting I’ll choose Zenoss or some service like NewRelic, Anturis, …
Thats the whole point of this tool, there are loads of centralised monitoring tools out there. NetData is for realtime monitoring of a server so needs to run on that server so its actually real time data your seeing.
Hi, it’s true, there are no remote agents, but…. check this, they have already an alternative to monitor distributed netdata servers https://github.com/firehol/netdata/wiki/mynetdata-menu-item
Wondering about how many load will com up when running this script it self.
However, nice post!
Hey, it’s a really superb monitoring tool very easy to monitor all via GUI but one thing mysql is not showing here where as in this article it showed it will monitor mysql also..Kindly confirm this..
@Vasim,
Yes, it has support MySQL monitoring also, but you need to do extra work here, you need to configure netdata to access MySQL on localhost to collect information, more information can be found here: https://github.com/firehol/netdata/wiki/mysql.chart.sh
Thanks @ravi ..
This is so cool. Thanks a lot for informing people about this wonderful tool. I was looking for something that monitors everything happening on my Linux server.