BCC (BPF Compiler Collection) is a powerful set of appropriate tools and example files for creating resourceful kernel tracing and manipulation programs.
It utilizes extended BPF (Berkeley Packet Filters), initially known as eBPF which was one of the new features in Linux 3.15.
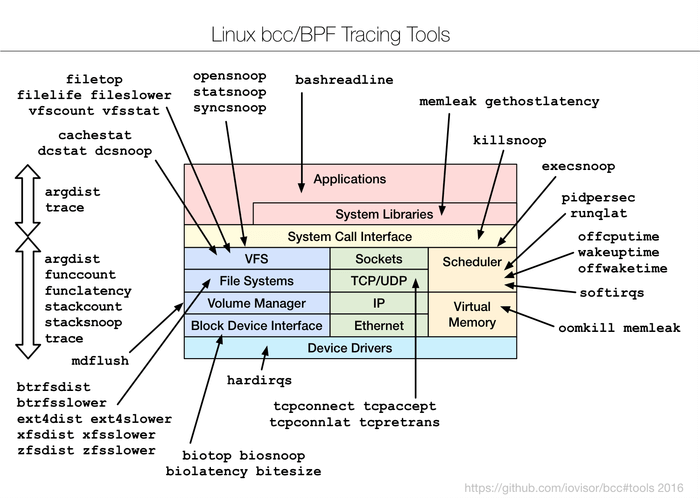
Practically, most of the components used by BCC require Linux 4.1 or above, and its noteworthy features include:
- Requires no 3rd party kernel module, since all the tools work based on BPF which is built into the kernel, and BCC uses features added in Linux 4.x series.
- Enables observation of software execution.
- Comprises of several performance analysis tools with example files and man pages.
Best suited for advanced Linux users, BCC makes it easy to write BPF programs using kernel instrumentation in C, and front-ends in Python and lua.
Additionally, it supports multiple tasks such as performance analysis, monitoring, network traffic control plus lots more.
How To Install BCC in Linux Systems
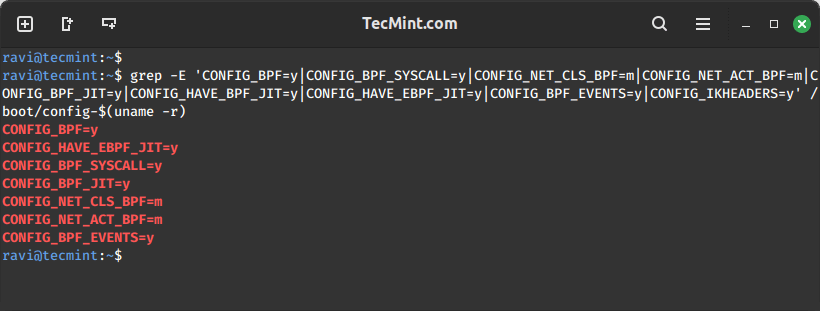
Remember that BCC uses features added in Linux kernel version 4.1 or above, and as a requirement, the kernel should have been compiled with the flags set below:
CONFIG_BPF=y
CONFIG_BPF_SYSCALL=y
# [optional, for tc filters]
CONFIG_NET_CLS_BPF=m
# [optional, for tc actions]
CONFIG_NET_ACT_BPF=m
CONFIG_BPF_JIT=y
# [for Linux kernel versions 4.1 through 4.6]
CONFIG_HAVE_BPF_JIT=y
# [for Linux kernel versions 4.7 and later]
CONFIG_HAVE_EBPF_JIT=y
# [optional, for kprobes]
CONFIG_BPF_EVENTS=y
# Need kernel headers through /sys/kernel/kheaders.tar.xz
CONFIG_IKHEADERS=y
You can check all the specified kernel configuration flags with a single grep command and provide all the flag names as patterns.
grep -E 'CONFIG_BPF=y|CONFIG_BPF_SYSCALL=y|CONFIG_NET_CLS_BPF=m|CONFIG_NET_ACT_BPF=m|CONFIG_BPF_JIT=y|CONFIG_HAVE_BPF_JIT=y|CONFIG_HAVE_EBPF_JIT=y|CONFIG_BPF_EVENTS=y|CONFIG_IKHEADERS=y' /boot/config-$(uname -r)
After verifying kernel flags, it’s time to install BCC tools in Linux systems.
Install BCC Tools on Debian
You can find bcc and its tools in the regular Debian main repository. They come from the source package bpfcc and are named bpfcc-tools, python3-bpfcc, libbpfcc, and libbpfcc-dev.
echo deb http://cloudfront.debian.net/debian sid main >> /etc/apt/sources.list
sudo apt-get install -y bpfcc-tools libbpfcc libbpfcc-dev linux-headers-$(uname -r)
Install BCC Tools on Ubuntu
You can find different versions of bcc in the regular Ubuntu Universe repository.
sudo apt-get install bpfcc-tools linux-headers-$(uname -r)
Install BCC Tools on Fedora
As of Fedora 40, bcc binaries are available in the standard repository.
sudo dnf install bcc
Install BCC Tools on RHEL
bcc is already included in the official yum repository as bcc-tools.
sudo yum install bcc-tools
Install BCC Tools on Arch Linux
bcc is available in the standard Arch repository and can be installed with the pacman command.
pacman -S bcc bcc-tools python-bcc
Install BCC Tools on openSUSE
For openSUSE Leap 42.2 (and later) and Tumbleweed, bcc is already included in the official repo.
sudo zypper ref
sudo zypper in bcc-tools bcc-examples
How To Use BCC Tools in Linux Systems
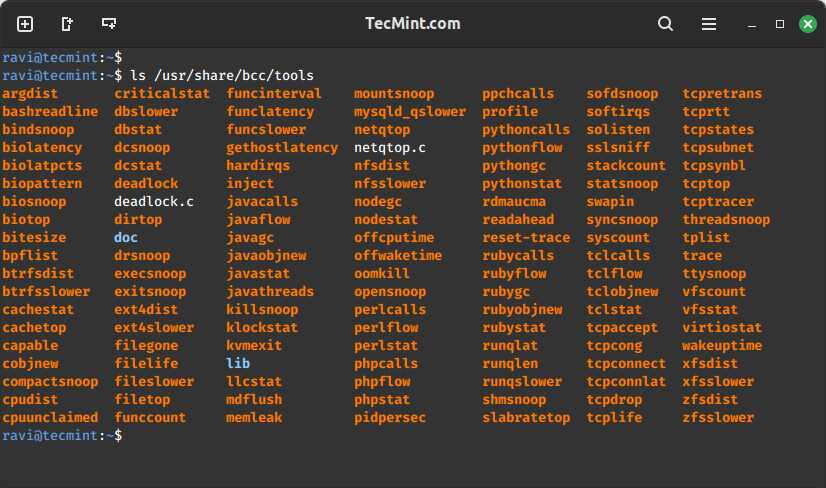
All the BCC tools are installed under /usr/share/bcc/tools directory. However, you can alternatively run them from the BCC Github repository under /tools where they end with an .py extension.
ls /usr/share/bcc/tools
We shall cover a few examples of – monitoring general Linux system performance and networking.
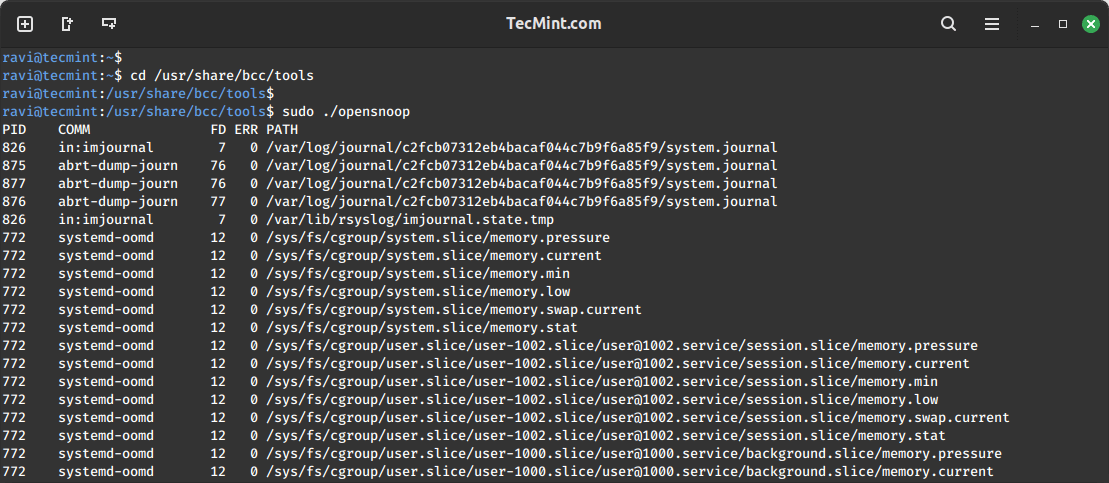
Tracing open() Syscalls in Linux
Let’s start by tracing all open() syscalls using opensnoop tool. This enables us to tell how various applications work by identifying their data files, config files, and many more:
cd /usr/share/bcc/tools
sudo ./opensnoop
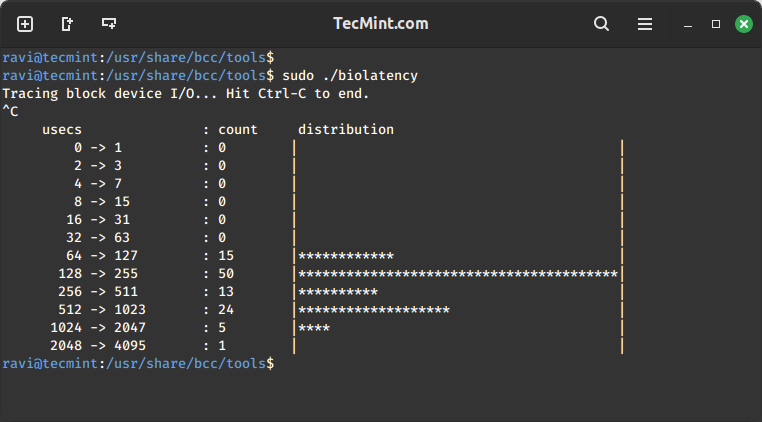
Analyzing Disk I/O Latency in Linux
This example shows a summarized distribution of disk I/O latency using biolatency tool. After executing the command, wait for a few minutes and hit Ctrl-C to end it and view the output.
sudo ./biolatency
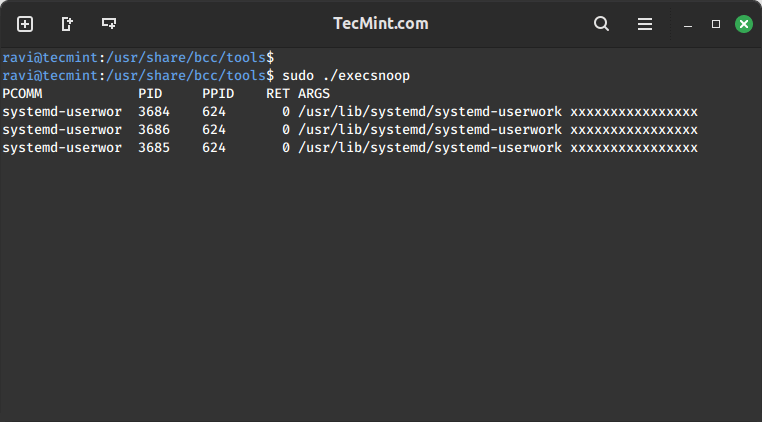
Tracing New Processes in Linux
In this section, we shall move to tracing new processes in execution using execsnoop tool. Each time a process is forked by fork() and exec() syscalls, it is shown in the output. However, not all processes are captured.
sudo ./execsnoop
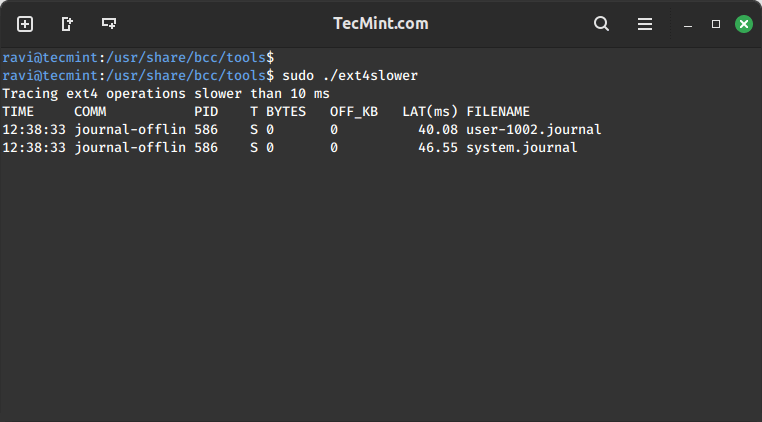
Trace Slower Ext4 File System Operations
Using ext4slower to trace the ext4 file system common operations that are slower than 10ms, to help us identify independently slow disk I/O via the file system.
It only outputs those operations that exceed a threshold:
sudo ./ext4slower
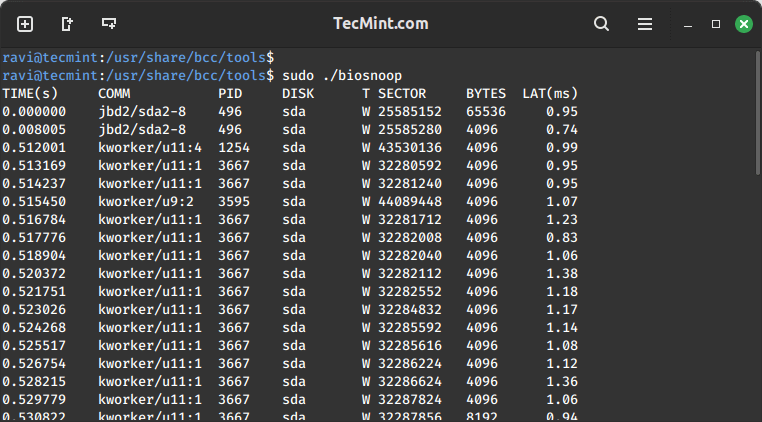
Exploring Disk I/O Activity with biosnoop
Next off, let’s dive into printing a line per disk I/O each second, with details such as process ID, sector, bytes, and latency among others using biosnoop tool:
sudo ./biosnoop
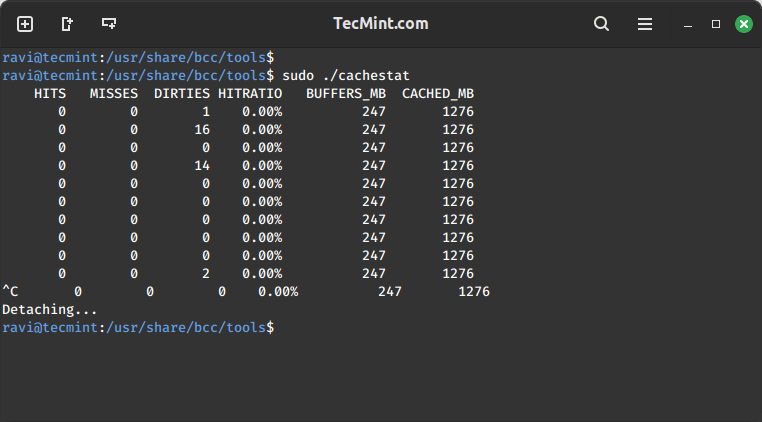
Analyzing System Cache Performance
Thereafter, we proceed to use cachestat tool to display one line of summarized statistics from the system cache every second. This enables for system tuning operations by pointing out low cache hit ratio and high rate of misses:
sudo ./cachestat
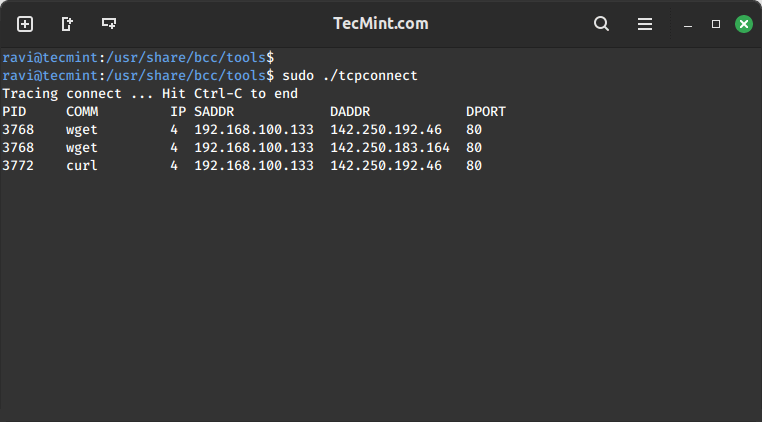
Monitoring TCP Connections in Linux
Monitoring TCP connections every second using tcpconnect tool. Its output includes source and destination address, and port number. This tool is useful for tracing unexpected TCP connections, thereby helping us to identify inefficiencies in application configurations or an attacker.
sudo ./tcpconnect
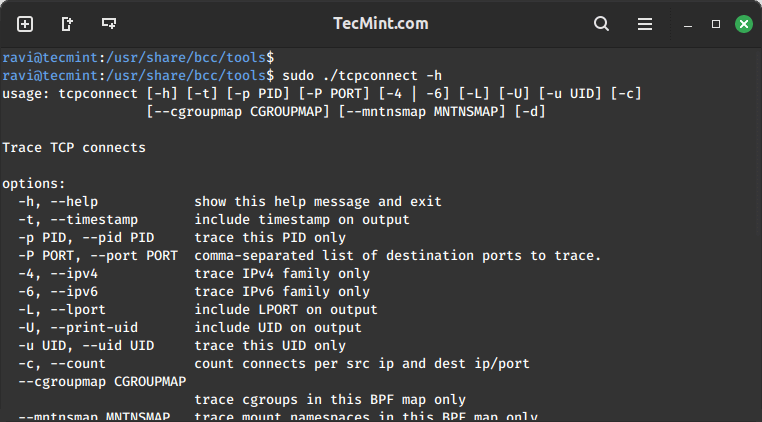
All the tools above can also be used with various options, to enable the help page for a given tool, make use of the -h option, for example:
sudo ./tcpconnect -h
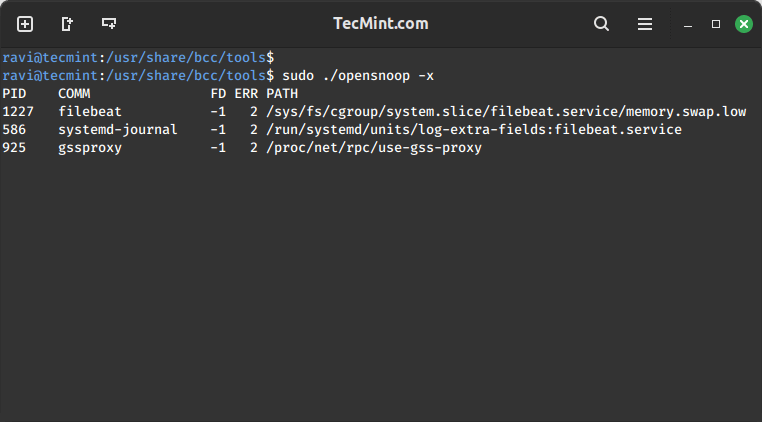
Trace Failed exec()s Syscalls
To trace failed exec()s syscalls, employ the -x option with opensnoop as below:
sudo ./opensnoop -x
Trace Particular Process Functions
The last example below demonstrates how to execute a custom trace operation. We are tracing a particular process using its PID.
First, determine the process ID:
pidof firefox
Later on, run the custom trace command. The command below -p specifies the process ID, do_sys_open() is a kernel function that is traced dynamically including its second argument as a string.
sudo ./trace -p 4095 'do_sys_open "%s", arg2'
Summary
BCC is a powerful and easy-to-use toolkit for various system administration tasks such as tracing system performance monitoring, tracing block device I/O, TCP functions, file system operations, syscalls, Node.js probes, plus lots more. Importantly, it ships with several example files and man pages for the tools to guide you, making it user friendly and reliable.
Last but not least, you can get back to us by sharing your thoughts about the subject, asking questions, making useful suggestions, or any constructive feedback via the comment section below.