If you are a person who is, or has been in the past, in charge of inspecting and analyzing system logs in Linux, you know what a nightmare that task can become if multiple services are being monitored simultaneously.
In days past, that task had to be done mostly manually, with each log type being handled separately. Fortunately, the combination of Elasticsearch, Logstash, and Kibana on the server side, along with Filebeat on the client side, makes that once difficult task look like a walk in the park today.
The first three components form what is called an ELK stack, whose main purpose is to collect logs from multiple servers at the same time (also known as centralized logging).
A built-in java-based web interface allows you to inspect logs quickly at a glance for easier comparison and troubleshooting. These client logs are sent to a central server by Filebeat, which can be described as a log shipping agent.
Testing Environment
Let’s see how all of these pieces fit together. Our test environment will consist of the following machines:
Central Server: RHEL with IP address 192.168.100.247
Client Machine #1: Fedora with IP address 192.168.100.133
Client Machine #2: Debian with IP address 192.168.0.134
Please note that the RAM requirements for the ELK Stack (Elasticsearch, Logstash, and Kibana) can vary based on factors such as data volume, complexity of queries, and the size of your environment.
How to Install ELK Stack on RHEL
Let’s begin by installing the ELK stack on the central server (which is our RHEL 9 system), the same instructions apply to RHEL-based distributions such as Rocky and Alma Linux.
Let’s understand with a brief explanation on what each component does:
- Elasticsearch stores the logs that are sent by the clients.
- Logstash processes those logs.
- Kibana provides the web interface that will help us to inspect and analyze the logs.
Install the following packages on the central server. First off, we will install Java JDK version 21, the latest one at the time of this writing), which is a dependency of the ELK components.
You may want to check first in the Java downloads page here to see if there is a newer update available.
yum update
cd /opt
wget https://download.oracle.com/java/21/latest/jdk-21_linux-x64_bin.rpm
rpm -Uvh jdk-21_linux-x64_bin.rpm
Time to check whether the installation completed successfully:
java -version


java version "21.0.2" 2024-01-16 LTS
Java(TM) SE Runtime Environment (build 21.0.2+13-LTS-58)
Java HotSpot(TM) 64-Bit Server VM (build 21.0.2+13-LTS-58, mixed mode, sharing)
To install the latest versions of Elasticsearch, Logstash, and Kibana, we will have to create repositories manually as follows:
Install Elasticsearch in RHEL
1. Import the Elasticsearch public GPG key to the rpm package manager.
rpm --import https://artifacts.elastic.co/GPG-KEY-elasticsearch
2. Insert the following lines to the repository configuration file elasticsearch.repo:
[elasticsearch]
name=Elasticsearch repository for 8.x packages
baseurl=https://artifacts.elastic.co/packages/8.x/yum
gpgcheck=1
gpgkey=https://artifacts.elastic.co/GPG-KEY-elasticsearch
enabled=0
autorefresh=1
type=rpm-md
3. Install the Elasticsearch package.
yum install --enablerepo=elasticsearch elasticsearch
When the installation is complete, you will be prompted to start and enable elasticsearch:
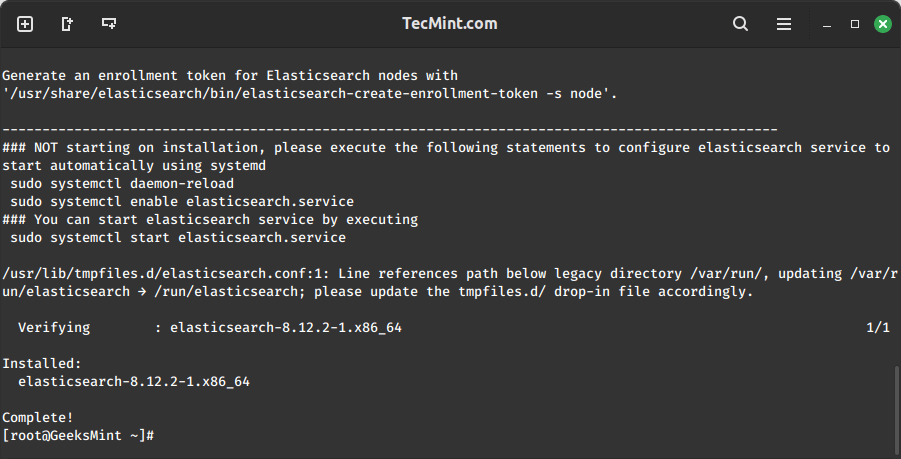
4. Start and enable the service.
systemctl daemon-reload
systemctl enable elasticsearch
systemctl start elasticsearch
5. Allow traffic through TCP port 9200 in your firewall:
firewall-cmd --add-port=9200/tcp
firewall-cmd --add-port=9200/tcp --permanent
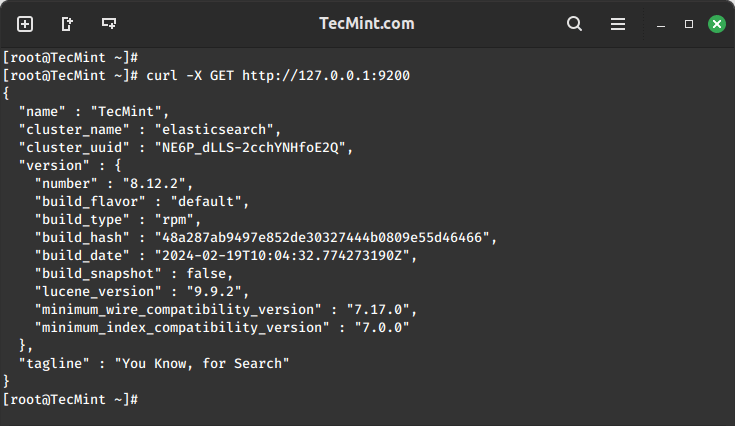
6. Check if Elasticsearch responds to simple requests over HTTP using curl command:
curl -X GET http://localhost:9200
The output of the above command should be similar to:
Make sure you complete the above steps and then proceed with Logstash. Since both Logstash and Kibana share the Elasticsearch GPG key, there is no need to re-import it before installing the packages.
Install Logstash in RHEL
7. Insert the following lines to the repository configuration file /etc/yum.repos.d/logstash.repo:
[logstash-8.x]
name=Elastic repository for 8.x packages
baseurl=https://artifacts.elastic.co/packages/8.x/yum
gpgcheck=1
gpgkey=https://artifacts.elastic.co/GPG-KEY-elasticsearch
enabled=1
autorefresh=1
type=rpm-md
8. Install the Logstash package:
yum install logstash
9. Add a SSL certificate based on the IP address of the ELK server at the following line below the [ v3_ca ] section in /etc/pki/tls/openssl.cnf:
[ v3_ca ]
subjectAltName = IP: 192.168.100.247
10. Generate a self-signed certificate valid for 365 days:
# cd /etc/pki/tls
# openssl req -config /etc/pki/tls/openssl.cnf -x509 -days 3650 -batch -nodes -newkey rsa:2048 -keyout private/logstash-forwarder.key -out certs/logstash-forwarder.crt
11. Configure Logstash input, output, and filter files:
Input: Create /etc/logstash/conf.d/input.conf and insert the following lines into it. This is necessary for Logstash to “learn” how to process beats coming from clients. Make sure the path to the certificate and key match the right paths as outlined in the previous step:
input {
  beats {
	port => 5044
	ssl => true
	ssl_certificate => "/etc/pki/tls/certs/logstash-forwarder.crt"
	ssl_key => "/etc/pki/tls/private/logstash-forwarder.key"
  }
}
Output (/etc/logstash/conf.d/output.conf) file:
output {
  elasticsearch {
	hosts => ["localhost:9200"]
	sniffing => true
	manage_template => false
	index => "%{[@metadata][beat]}-%{+YYYY.MM.dd}"
	document_type => "%{[@metadata][type]}"
  }
}
Filter (/etc/logstash/conf.d/filter.conf) file. We will log syslog messages for simplicity:
filter {
if [type] == "syslog" {
	grok {
  	match => { "message" => "%{SYSLOGLINE}" }
	}

	date {
match => [ "timestamp", "MMM  d HH:mm:ss", "MMM dd HH:mm:ss" ]
}
  }
}
12. Start and enable logstash:
systemctl daemon-reload
systemctl start logstash
systemctl enable logstash
13. Configure the firewall to allow Logstash to get the logs from the clients (TCP port 5044):
firewall-cmd --add-port=5044/tcp
firewall-cmd --add-port=5044/tcp --permanent
Install Kibana in RHEL
13. Insert the following lines to the repository configuration file /etc/yum.repos.d/kibana.repo:
[kibana-8.x]
name=Kibana repository for 8.x packages
baseurl=https://artifacts.elastic.co/packages/8.x/yum
gpgcheck=1
gpgkey=https://artifacts.elastic.co/GPG-KEY-elasticsearch
enabled=1
autorefresh=1
type=rpm-md
14. Install the Kibana package:
yum install kibana
15. Start and enable Kibana.
systemctl daemon-reload
systemctl start kibana
systemctl enable kibana
16. Make sure you can access access Kibana’s web interface from another computer (allow traffic on TCP port 5601):
firewall-cmd --add-port=5601/tcp
firewall-cmd --add-port=5601/tcp --permanent
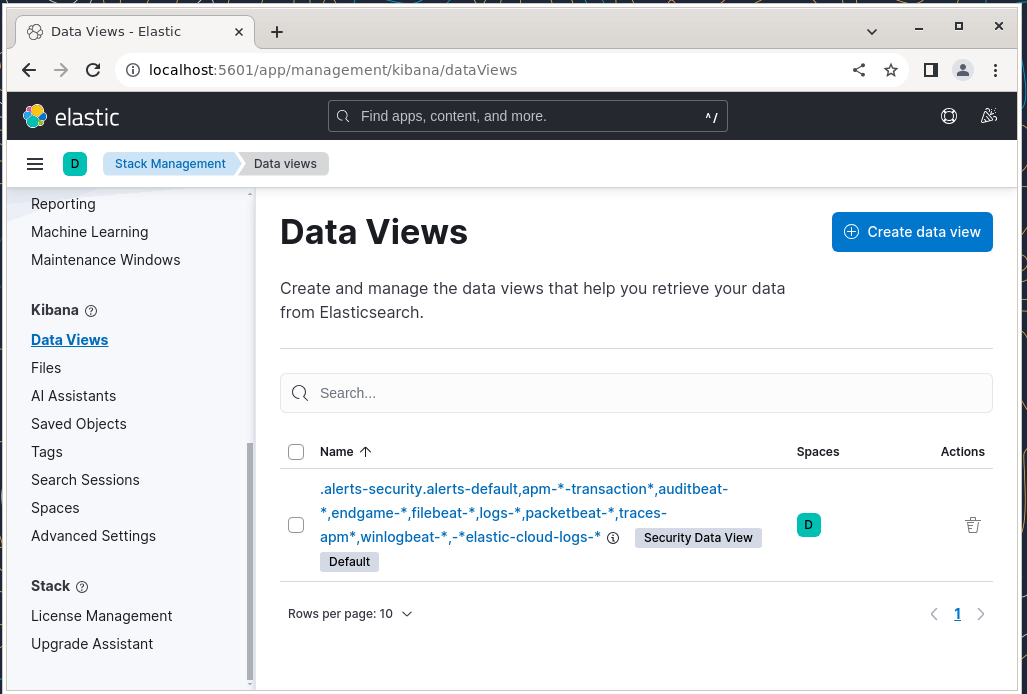
17. Launch Kibana to verify that you can access the web interface:
http://localhost:5601
OR
http://IP.com:5601
Install Filebeat on the Client Machine
We will show you how to do this for Client #1 (repeat for Client #2 afterward, changing paths if applicable to your distribution).
1. Copy the SSL certificate from the server to the clients using the scp command:
scp /etc/pki/tls/certs/logstash-forwarder.crt [email protected]:/etc/pki/tls/certs/
2. Import the Elasticsearch public GPG key to the rpm package manager on the client machine:
rpm --import https://artifacts.elastic.co/GPG-KEY-elasticsearch
3. Create a repository for Filebeat (/etc/yum.repos.d/filebeat.repo) in RHEL-based distributions:
[elastic-8.x]
name=Elastic repository for 8.x packages
baseurl=https://artifacts.elastic.co/packages/8.x/yum
gpgcheck=1
gpgkey=https://artifacts.elastic.co/GPG-KEY-elasticsearch
enabled=1
autorefresh=1
type=rpm-md
4. Configure the source to install Filebeat on Debian-based distributions:
wget -qO - https://artifacts.elastic.co/GPG-KEY-elasticsearch | sudo apt-key add -
sudo apt-get install apt-transport-https
echo "deb https://artifacts.elastic.co/packages/8.x/apt stable main" | sudo tee -a /etc/apt/sources.list.d/elastic-8.x.list
5. Install the Filebeat package:
yum install filebeat   [On RHEL and based Distros]
apt install filebeat   [On Debian and its derivatives]
6. Start and enable Filebeat:
systemctl start filebeat
systemctl enable filebeat
Configure Filebeat
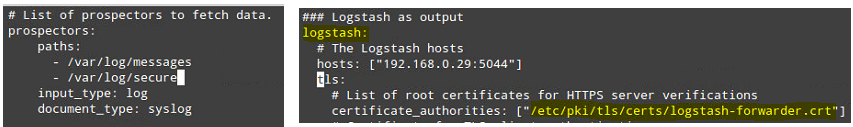
A word of caution here. Filebeat configuration is stored in a YAML file, which requires strict indentation. Be careful with this as you edit /etc/filebeat/filebeat.yml as follows:
- Under paths, indicate which log files should be “shipped” to the ELK server.
- Under prospectors:
input_type: log
document_type: syslog
- Under output:
- Uncomment the line that begins with logstash.
- Indicate the IP address of your ELK server and port where Logstash is listening in hosts.
- Make sure the path to the certificate points to the actual file you created in Step I (Logstash section) above.
The above steps are illustrated in the following image:
Save changes, and then restart Filebeat on the clients:
systemctl restart filebeat
Once we have completed the above steps on the clients, feel free to proceed.
Testing Filebeat
In order to verify that the logs from the clients can be sent and received successfully, run the following command on the ELK server:
curl -XGET 'http://localhost:9200/filebeat-*/_search?pretty'
The output should be similar to (notice how messages from /var/log/messages and /var/log/secure are being received from client1 and client2):
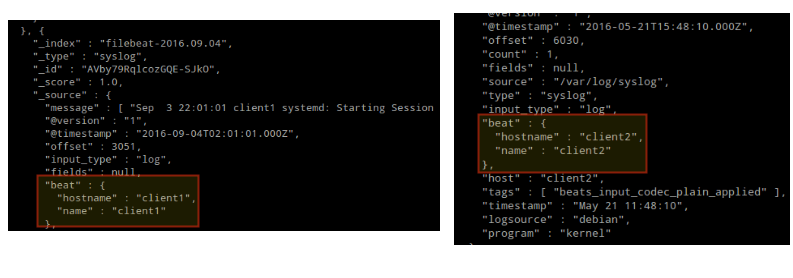
Otherwise, check the Filebeat configuration file for errors.
# journalctl -xe
after attempting to restart Filebeat will point you to the offending line(s).
Testing Kibana
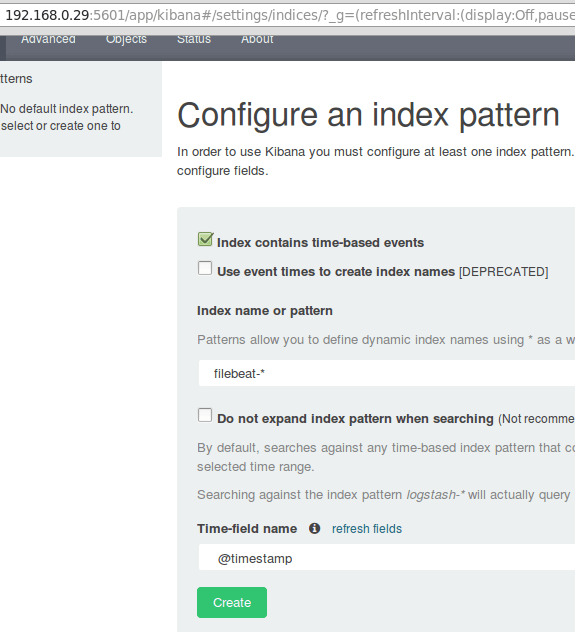
After we have verified that logs are being shipped by the clients and received successfully on the server. The first thing that we will have to do in Kibana is configure an index pattern and set it as default.
You can describe an index as a full database in a relational database context. We will go with filebeat-* (or you can use more precise search criteria as explained in the official documentation).
Enter filebeat-* in the Index name or pattern field and then click Create:
Please note that you will be allowed to enter a more fine-grained search criteria later. Next, click the star inside the green rectangle to configure it as the default index pattern:

Finally, in the Discover menu, you will find several fields to add to the log visualization report. Just hover over them and click Add:
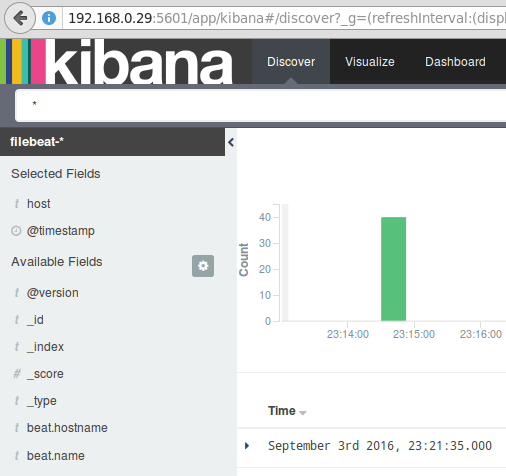
The results will be shown in the central area of the screen as shown above. Feel free to play around (add and remove fields from the log report) to become familiar with Kibana.
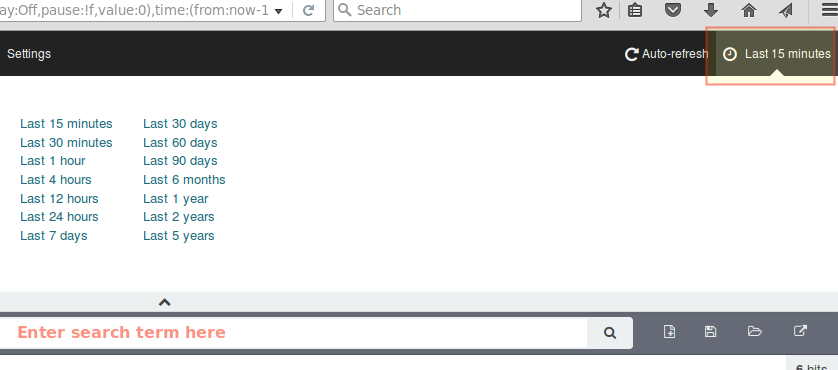
By default, Kibana will display the records that were processed during the last 15 minutes (see upper right corner) but you can change that behavior by selecting another time frame:
Summary
In this article, we have explained how to set up an ELK stack to collect the system logs sent by two clients, a Fedora, and a Debian machine.
Now you can refer to the official Elasticsearch documentation and find more details on how to use this setup to inspect and analyze your logs more efficiently.
If you have any questions, don’t hesitate to ask. We look forward to hearing from you.


I’m getting below errors in logstash ( using elk version 7.6)
[2020-03-07T13:35:38,777][WARN ][org.logstash.instrument.metrics.gauge.LazyDelegatingGauge][main] A gauge metric of an unknown type (org.jruby.specialized.RubyArrayOneObject) has been create for key: cluster_uuids. This may result in invalid serialization. It is recommended to log an issue to the responsible developer/development team.
[2020-03-07T13:35:38,340][INFO ][logstash.outputs.elasticsearch][main] ES Output version determined {:es_version=>7}
[2020-03-07T13:35:38,345][WARN ][logstash.outputs.elasticsearch][main] Detected a 6.x and above cluster: the `type` event field won’t be used to determine the document _type {:es_version=>7}
Please what’s the path for the
kibana.yml, I seem not to get the directory.Very nice tutorial..
Just correct days in opeenssl self-sign certificate command.
# openssl req -config /etc/pki/tls/openssl.cnf -x509 -days 3650 -batch -nodes -newkey rsa:2048 -keyout private/logstash-forwarder.key -out certs/logstash-forwarder.crtHello Sir,
I have deployed ELK on CentOS 7 and everything does look fine but the problem that I have been facing is repeated logs. I have been getting the same logs again and again even from previous days. It would be great if you could help me out.
Thanks
How to ship apache web server logs to elasticsearch ?
Dear Brother, I will continue to install ELK flow as your instruction previous all command work properly but when I apply this command then command not work properly
Please help me.
Hello @Lokman dont tell me you have been applying apptitude command in Centos 7 ?
Hi,
Warning No default index pattern. You must select or create one to continue.
Output from elastic server and kibana:
curl ‘localhost:9200/_cat/indices?v’
health status index pri rep docs.count docs.deleted store.size pri.store.size
yellow open .kibana 1 1 1 0 3.1kb 3.1kb

curl -XGET ‘http://localhost:9200/filebeat-*/_search?pretty’
{
“took” : 1,
“timed_out” : false,
“_shards” : {
“total” : 0,
“successful” : 0,
“failed” : 0
},
“hits” : {
“total” : 0,
“max_score” : 0.0,
“hits” : [ ]
}
}
So, I am unable to find out the issue, is there something missing.
have you found the solution
I have installed ELK stack using the set up mentioned and it seems to have installed properly. all the services are running fine. However i am unable to access kibana on the my server ip and port. it says site can’t be reached. I have crated firewall exception as mentioned above. i am getting curl response on localhost:5601.
Hello everyone !
I am trying to fetch log file data from more than two agent-node to logstash server, but i am able to fetch data from one agent-node only.
This document is very good and I have followed the same to create elasticsearch environment except accepting log files from different server.
can anyone suggest how to resolve this ?
I recommend OpenJDK since it comes as a package already for CentOS7.
yum install java-1.8.0-openjdk-headless
Headless version leaves out graphical components and package dependencies which is nice for a server-only install.
# service logstash configtest
doesnt work with elk version 5 on centos 7
I confirmed the “service logstash configtest” also doesn’t work on CentOS 7 for ELK v5
Hi ,
I have installed Elastic search, log stash and kibana successfully but kibana graph says ” unable to fetch data” and cannot create index pattern
Output from elastic server and kibana:
curl ‘localhost:9200/_cat/indices?v’
health status index pri rep docs.count docs.deleted store.size pri.store.size
yellow open .kibana 1 1 1 0 3.1kb 3.1kb
curl -XGET ‘http://localhost:9200/filebeat-*/_search?pretty’
{
“took” : 1,
“timed_out” : false,
“_shards” : {
“total” : 0,
“successful” : 0,
“failed” : 0
},
“hits” : {
“total” : 0,
“max_score” : 0.0,
“hits” : [ ]
}
}
So, i’m unable to findout the issue , is there something missing .
Hello Gabriel,
It is very interesting article you published and according to my opinion one of the best I saw, regarding this issue. What I do not get to be clear is how calculate space needed by the server to control all logs and how it could store the information in a database for a period of one year. The same has to be politacas postgres by the company. Greetings from Buenos Aires.
Federico,
I’ll reply in English (even though both of us speak Spanish) for the reference of future visitors to this post :). As with other scenarios where storage space has to be determined, it depends largely on how many logs you wish to manage and how verbose you want to make them. That will give you a glimpse of the necessary space to store the logs for a year.
On a side note, I do not understand what you mean by “…The same has to be politacas postgres by the company“. Can you please clarify?
Thanks for a great post!
Thank you for taking the time to comment! I’m glad you found my post useful.
Hi Sir,
I am new new to this technical part, while following your instructions on both server and client (centos 7).
curl -XGET 'http://localhost:9200/filebeat-*/_search?pretty'
{
  "took" : 1,
  "timed_out" : false,
  "_shards" : {
    "total" : 0,
    "successful" : 0,
    "failed" : 0
  },
  "hits" : {
    "total" : 0,
    "max_score" : 0.0,
    "hits" : [ ]
  }
}
I just got this only, not login please help me…
i followed all steps everything executed properly , SELINUX IS DISABLED but once i am opening http://ip:5601 , its not opening page ..The connection has timed out
Is that port open on your firewall?
I think this is my issue on the clients regarding Filebeat: “/usr/bin/filebeat[6387]: transport.go:125: SSL client failed to connect with: dial tcp x.x.x.x:5044: getsockopt: connection refused”.
I’m now having an issue with Filebeat. I can only see stats from my ElkServer. I don’t have anything from the Client Servers. when I run:
curl -XGET ‘http://localhost:9200/filebeat-*/_search?pretty’
My clients are on Centos 6 32-bit, so I had to use the following to install:
curl -L -O https://download.elastic.co/beats/filebeat/filebeat-1.3.0-i686.rpm
rpm -Uvh filebeat-1.3.0-i686.rpm
My file: /etc/filebeat/filebeat.yml is identical to the Elk Server that works.
Am I missing something? ie. ports, config somewhere…
This is my output:
curl -XGET ‘http://localhost:9200/filebeat-*/_search?pretty’
{
“took” : 8,
“timed_out” : false,
“_shards” : {
“total” : 5,
“successful” : 5,
“failed” : 0
},
“hits” : {
“total” : 4096,
“max_score” : 1.0,
“hits” : [ {
“_index” : “filebeat-2016.09.09”,
“_type” : “syslog”,
“_id” : “AVcPPp7AigWXUuN_Qo60”,
“_score” : 1.0,
“_source” : {
“@timestamp” : “2016-09-09T13:59:04.400Z”,
“beat” : {
“hostname” : “VM-LXPDElkStack”,
“name” : “VM-LXPDElkStack”
},
“count” : 1,
“fields” : null,
“input_type” : “log”,
“message” : “Sep 6 09:26:30 VM-LXPDElkStack unix_chkpwd[26690]: password check failed for user (root)”,
“offset” : 0,
“source” : “/var/log/secure”,
“type” : “syslog”
}
}, {
“_index” : “filebeat-2016.09.09”,
“_type” : “syslog”,
“_id” : “AVcPPp7AigWXUuN_Qo66”,
“_score” : 1.0,
“_source” : {
“@timestamp” : “2016-09-09T13:59:04.400Z”,
“beat” : {
“hostname” : “VM-LXPDElkStack”,
“name” : “VM-LXPDElkStack”
},
“count” : 1,
“fields” : null,
“input_type” : “log”,
“message” : “Sep 6 09:38:41 VM-LXPDElkStack sshd[26896]: Accepted password for root from 172.22.2.90 port 50049 ssh2”,
“offset” : 616,
“source” : “/var/log/secure”,
“type” : “syslog”
}
}, {
“_index” : “filebeat-2016.09.09”,
“_type” : “syslog”,
“_id” : “AVcPPp7AigWXUuN_Qo67”,
“_score” : 1.0,
“_source” : {
“@timestamp” : “2016-09-09T13:59:04.400Z”,
“beat” : {
“hostname” : “VM-LXPDElkStack”,
“name” : “VM-LXPDElkStack”
},
“count” : 1,
“fields” : null,
“input_type” : “log”,
“message” : “Sep 6 09:38:41 VM-LXPDElkStack sshd[26896]: pam_unix(sshd:session): session opened for user root by (uid=0)”,
“offset” : 721,
“source” : “/var/log/secure”,
“type” : “syslog”
}
}, {
“_index” : “filebeat-2016.09.09”,
“_type” : “syslog”,
“_id” : “AVcPPp7AigWXUuN_Qo6-“,
“_score” : 1.0,
“_source” : {
“@timestamp” : “2016-09-09T13:59:04.400Z”,
“beat” : {
“hostname” : “VM-LXPDElkStack”,
“name” : “VM-LXPDElkStack”
},
“count” : 1,
“fields” : null,
“input_type” : “log”,
“message” : “Sep 6 09:49:11 VM-LXPDElkStack polkitd[840]: Registered Authentication Agent for unix-process:27095:32300900 (system bus name :1.1289 [/usr/bin/pkttyagent –notify-fd 5 –fallback], object path /org/freedesktop/PolicyKit1/AuthenticationAgent, locale en_CA.UTF-8)”,
“offset” : 1044,
“source” : “/var/log/secure”,
“type” : “syslog”
}
}, {
“_index” : “filebeat-2016.09.09”,
“_type” : “syslog”,
“_id” : “AVcPPp7AigWXUuN_Qo6_”,
“_score” : 1.0,
“_source” : {
“@timestamp” : “2016-09-09T13:59:04.400Z”,
“beat” : {
“hostname” : “VM-LXPDElkStack”,
“name” : “VM-LXPDElkStack”
},
“count” : 1,
“fields” : null,
“input_type” : “log”,
“message” : “Sep 6 09:49:11 VM-LXPDElkStack polkitd[840]: Unregistered Authentication Agent for unix-process:27095:32300900 (system bus name :1.1289, object path /org/freedesktop/PolicyKit1/AuthenticationAgent, locale en_CA.UTF-8) (disconnected from bus)”,
“offset” : 1308,
“source” : “/var/log/secure”,
“type” : “syslog”
}
}, {
“_index” : “filebeat-2016.09.09”,
“_type” : “syslog”,
“_id” : “AVcPPp7AigWXUuN_Qo7D”,
“_score” : 1.0,
“_source” : {
“@timestamp” : “2016-09-09T13:59:04.400Z”,
“beat” : {
“hostname” : “VM-LXPDElkStack”,
“name” : “VM-LXPDElkStack”
},
“count” : 1,
“fields” : null,
“input_type” : “log”,
“message” : “Sep 6 09:55:39 VM-LXPDElkStack polkitd[840]: Registered Authentication Agent for unix-process:27199:32339699 (system bus name :1.1294 [/usr/bin/pkttyagent –notify-fd 5 –fallback], object path /org/freedesktop/PolicyKit1/AuthenticationAgent, locale en_CA.UTF-8)”,
“offset” : 1863,
“source” : “/var/log/secure”,
“type” : “syslog”
}
}, {
“_index” : “filebeat-2016.09.09”,
“_type” : “syslog”,
“_id” : “AVcPPp7AigWXUuN_Qo7K”,
“_score” : 1.0,
“_source” : {
“@timestamp” : “2016-09-09T13:59:04.400Z”,
“beat” : {
“hostname” : “VM-LXPDElkStack”,
“name” : “VM-LXPDElkStack”
},
“count” : 1,
“fields” : null,
“input_type” : “log”,
“message” : “Sep 6 10:03:16 VM-LXPDElkStack sshd[27344]: Accepted password for root from 172.22.2.90 port 50171 ssh2”,
“offset” : 3189,
“source” : “/var/log/secure”,
“type” : “syslog”
}
}, {
“_index” : “filebeat-2016.09.09”,
“_type” : “syslog”,
“_id” : “AVcPPp7AigWXUuN_Qo7M”,
“_score” : 1.0,
“_source” : {
“@timestamp” : “2016-09-09T13:59:04.400Z”,
“beat” : {
“hostname” : “VM-LXPDElkStack”,
“name” : “VM-LXPDElkStack”
},
“count” : 1,
“fields” : null,
“input_type” : “log”,
“message” : “Sep 6 10:03:16 VM-LXPDElkStack sshd[27344]: pam_unix(sshd:session): session closed for user root”,
“offset” : 3403,
“source” : “/var/log/secure”,
“type” : “syslog”
}
}, {
“_index” : “filebeat-2016.09.09”,
“_type” : “syslog”,
“_id” : “AVcPPp7AigWXUuN_Qo7a”,
“_score” : 1.0,
“_source” : {
“@timestamp” : “2016-09-09T13:59:04.400Z”,
“beat” : {
“hostname” : “VM-LXPDElkStack”,
“name” : “VM-LXPDElkStack”
},
“count” : 1,
“fields” : null,
“input_type” : “log”,
“message” : “Sep 6 10:33:33 VM-LXPDElkStack sshd[27973]: Accepted password for root from 172.22.2.90 port 51083 ssh2”,
“offset” : 6348,
“source” : “/var/log/secure”,
“type” : “syslog”
}
}, {
“_index” : “filebeat-2016.09.09”,
“_type” : “syslog”,
“_id” : “AVcPPp7AigWXUuN_Qo7b”,
“_score” : 1.0,
“_source” : {
“@timestamp” : “2016-09-09T13:59:04.400Z”,
“beat” : {
“hostname” : “VM-LXPDElkStack”,
“name” : “VM-LXPDElkStack”
},
“count” : 1,
“fields” : null,
“input_type” : “log”,
“message” : “Sep 6 10:33:33 VM-LXPDElkStack sshd[27973]: pam_unix(sshd:session): session opened for user root by (uid=0)”,
“offset” : 6453,
“source” : “/var/log/secure”,
“type” : “syslog”
}
} ]
}
}
You pasted the output of curl, but I can’t see your configuration files. Did you intend to share those as well?
thank you for nice tutorial bro :)
i wanna ask you, can we send logs to logstash dynamically?
because in my case, my filebeat not pushing the logs to logstash dynamically.
so, i have to manually restart filebeat each and everytime so as to send the
logs from filebeat to logstash.
So please let me know about this.
Thankyou
@RedL,
If you followed the steps outlined in this article, the logs should be pushed to the server automatically without intervention on your side. Check your setup and make sure it matches each step provided here.
I have done followed the steps, but the filebeat still need restart to pushing logs to logstash.
can you help me ?
If you can share your configuration files, I’ll be glad to take a look. We’ll also need distribution and version.
I’m getting the following error while installing filebeat:
yum install filebeat
Loaded plugins: downloadonly, fastestmirror
Loading mirror speeds from cached hostfile
* base: mirrors.cmich.edu
* epel: mirror.steadfast.net
* extras: centos.mirror.lstn.net
* rpmfusion-free-updates: lug.mtu.edu
* rpmfusion-free-updates-testing: lug.mtu.edu
* rpmfusion-nonfree-updates: lug.mtu.edu
* rpmfusion-nonfree-updates-testing: lug.mtu.edu
* updates: mirror.cisp.com
http://mirrors.cmich.edu/centos/6.5/os/i386/repodata/repomd.xml: [Errno 14] PYCURL ERROR 22 – “The requested URL returned error: 404 Not Found”
Trying other mirror.
http://holmes.umflint.edu/centos/6.5/os/i386/repodata/repomd.xml: [Errno 14] PYCURL ERROR 22 – “The requested URL returned error: 404 Not Found”
Trying other mirror.
http://mirrors.seas.harvard.edu/centos/6.5/os/i386/repodata/repomd.xml: [Errno 14] PYCURL ERROR 22 – “The requested URL returned error: 404 Not Found”
Trying other mirror.
http://ftp.linux.ncsu.edu/pub/CentOS/6.5/os/i386/repodata/repomd.xml: [Errno 14] PYCURL ERROR 22 – “The requested URL returned error: 404 Not Found”
Trying other mirror.
http://ftpmirror.your.org/pub/centos/6.5/os/i386/repodata/repomd.xml: [Errno 14] PYCURL ERROR 22 – “The requested URL returned error: 404 Not Found”
Trying other mirror.
http://centos.corenetworks.net/6.5/os/i386/repodata/repomd.xml: [Errno 14] PYCURL ERROR 22 – “The requested URL returned error: 404 Not Found”
Trying other mirror.
http://mirrors.arsc.edu/centos/6.5/os/i386/repodata/repomd.xml: [Errno 14] PYCURL ERROR 22 – “The requested URL returned error: 404 Not Found”
Trying other mirror.
http://mirrors.gigenet.com/centos/6.5/os/i386/repodata/repomd.xml: [Errno 14] PYCURL ERROR 22 – “The requested URL returned error: 404 Not Found”
Trying other mirror.
http://mirror.kentdigital.net/6.5/os/i386/repodata/repomd.xml: [Errno 14] PYCURL ERROR 6 – “Couldn’t resolve host ‘mirror.kentdigital.net'”
Trying other mirror.
http://mirrors.einstein.yu.edu/centos/6.5/os/i386/repodata/repomd.xml: [Errno 14] PYCURL ERROR 7 – “couldn’t connect to host”
Trying other mirror.
https://packages.elastic.co/beats/yum/el/i386/repodata/repomd.xml: [Errno 14] PYCURL ERROR 22 – “The requested URL returned error: 404 Not Found”
Trying other mirror.
Error: Cannot retrieve repository metadata (repomd.xml) for repository: filebeat. Please verify its path and try again
You’re getting this error because you’re using a URL that does not exist. Type http://mirrors.cmich.edu/centos/6.5/os/i386/repodata/repomd.xml in your browser and you’ll see :). Although this article was written with CentOS / RHEL 7 in mind, you can certainly use 6.5 but you’ll need the right URL for the repository.
I am getting yum failure while installing elasticsearch. Below is my elasticsearch.repo file and error log
-> elasticsearch.repo
elasticsearch-2.4]
name=Elasticsearch repository for 2.4 packages
baseurl=http://packages.elastic.co/elasticsearch/2.4/centos
gpgcheck=1
gpgkey=http://packages.elastic.co/GPG-KEY-elasticsearch
enabled=1
— Yum error logs —
http://packages.elastic.co/elasticsearch/2.4/centos/repodata/repomd.xml: [Errno 14] HTTP Error 404 – Not Found
You are obviously using a different repository configuration than the one we’re using in this article. Take a look at step 2 near the top of this post and you will see why it’s not working :).
so you mean to say 2.4 is replaced by 2.x , than it pick random version ?
2.x means it’s valid for all updates of version 2. No need to replace the x with a number – just use the URL we provided in this article.