As a system engineer, you will often need to produce reports that show the utilization of your system’s resources in order to make sure that: 1) they are being utilized optimally, 2) prevent bottlenecks, and 3) ensure scalability, among other reasons.

Besides the well-known native Linux tools that are used to check disk, memory, and CPU usage – to name a few examples, Red Hat Enterprise Linux 7 provides two additional toolsets to enhance the data you can collect for your reports: sysstat and dstat.
In this article we will describe both, but let’s first start by reviewing the usage of the classic tools.
Native Linux Tools
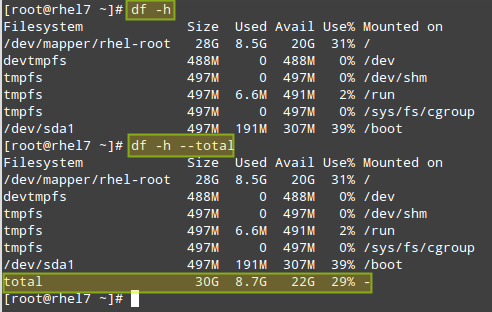
With df, you will be able to report disk space and inode usage of by filesystem. You need to monitor both because a lack of space will prevent you from being able to save further files (and may even cause the system to crash), just like running out of inodes will mean you can’t link further files with their corresponding data structures, thus producing the same effect: you won’t be able to save those files to disk.
# df -h 		[Display output in human-readable form]
# df -h --total         [Produce a grand total]
# df -i 		[Show inode count by filesystem]
# df -i --total 	[Produce a grand total]

With du, you can estimate file space usage by either file, directory, or filesystem.
For example, let’s see how much space is used by the /home directory, which includes all of the user’s personal files. The first command will return the overall space currently used by the entire /home directory, whereas the second will also display a disaggregated list by sub-directory as well:
# du -sch /home
# du -sch /home/*

Don’t Miss:
- 12 ‘df’ Command Examples to Check Linux Disk Space Usage
- 10 ‘du’ Command Examples to Find Disk Usage of Files/Directories
Another utility that can’t be missing from your toolset is vmstat. It will allow you to see at a quick glance information about processes, CPU and memory usage, disk activity, and more.
If run without arguments, vmstat will return averages since the last reboot. While you may use this form of the command once in a while, it will be more helpful to take a certain amount of system utilization samples, one after another, with a defined time separation between samples.
For example,
# vmstat 5 10
will return 10 samples taken every 5 seconds:
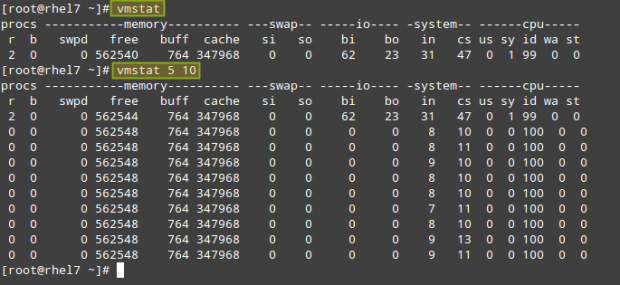
As you can see in the above picture, the output of vmstat is divided by columns: procs (processes), memory, swap, io, system, and cpu. The meaning of each field can be found in the FIELD DESCRIPTION sections in the man page of vmstat.
Where can vmstat come in handy? Let’s examine the behavior of the system before and during a yum update:
# vmstat -a 1 5
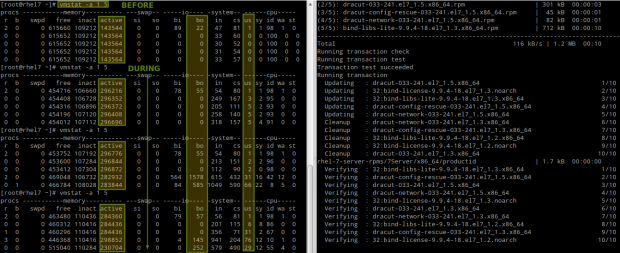
Please note that as files are being modified on disk, the amount of active memory increases and so does the number of blocks written to disk (bo) and the CPU time that is dedicated to user processes (us).
Or during the saving process of a large file directly to disk (caused by dsync):
# vmstat -a 1 5
# dd if=/dev/zero of=dummy.out bs=1M count=1000 oflag=dsync
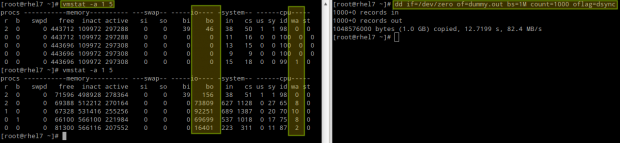
In this case, we can see a yet larger number of blocks being written to disk (bo), which was to be expected, but also an increase of the amount of CPU time that it has to wait for I/O operations to complete before processing tasks (wa).
Don’t Miss: Vmstat – Linux Performance Monitoring
Other Linux Tools
As mentioned in the introduction of this chapter, there are other tools that you can use to check the system status and utilization (they are not only provided by Red Hat but also by other major distributions from their officially supported repositories).
The sysstat package contains the following utilities:
- sar (collect, report, or save system activity information).
- sadf (display data collected by sar in multiple formats).
- mpstat (report processors related statistics).
- iostat (report CPU statistics and I/O statistics for devices and partitions).
- pidstat (report statistics for Linux tasks).
- nfsiostat (report input/output statistics for NFS).
- cifsiostat (report CIFS statistics) and
- sa1 (collect and store binary data in the system activity daily data file.
- sa2 (write a daily report in the /var/log/sa directory) tools.
whereas dstat adds some extra features to the functionality provided by those tools, along with more counters and flexibility. You can find an overall description of each tool by running yum info sysstat or yum info dstat, respectively, or checking the individual man pages after installation.
To install both packages:
# yum update && yum install sysstat dstat
The main configuration file for sysstat is /etc/sysconfig/sysstat. You will find the following parameters in that file:
# How long to keep log files (in days).
# If value is greater than 28, then log files are kept in
# multiple directories, one for each month.
HISTORY=28
# Compress (using gzip or bzip2) sa and sar files older than (in days):
COMPRESSAFTER=31
# Parameters for the system activity data collector (see sadc manual page)
# which are used for the generation of log files.
SADC_OPTIONS="-S DISK"
# Compression program to use.
ZIP="bzip2"
When sysstat is installed, two cron jobs are added and enabled in /etc/cron.d/sysstat. The first job runs the system activity accounting tool every 10 minutes and stores the reports in /var/log/sa/saXX where XX is the day of the month.
Thus, /var/log/sa/sa05 will contain all the system activity reports from the 5th of the month. This assumes that we are using the default value in the HISTORY variable in the configuration file above:
*/10 * * * * root /usr/lib64/sa/sa1 1 1
The second job generates a daily summary of process accounting at 11:53 pm every day and stores it in /var/log/sa/sarXX files, where XX has the same meaning as in the previous example:
53 23 * * * root /usr/lib64/sa/sa2 -A
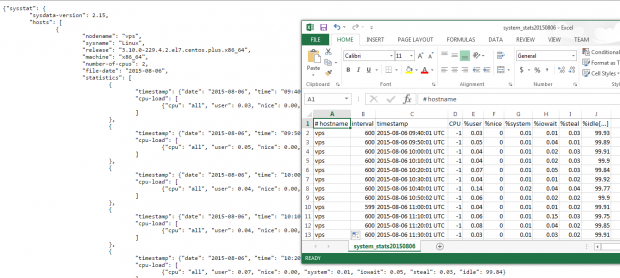
For example, you may want to output system statistics from 9:30 am through 5:30 pm of the sixth of the month to a .csv file that can easily be viewed using LibreOffice Calc or Microsoft Excel (this approach will also allow you to create charts or graphs):
# sadf -s 09:30:00 -e 17:30:00 -dh /var/log/sa/sa06 -- | sed 's/;/,/g' > system_stats20150806.csv
You could alternatively use the -j flag instead of -d in the sadf command above to output the system stats in JSON format, which could be useful if you need to consume the data in a web application, for example.
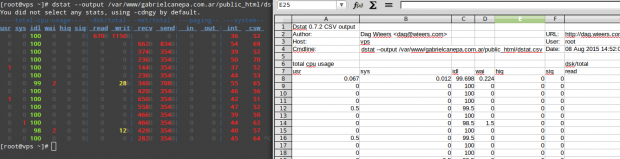
Finally, let’s see what dstat has to offer. Please note that if run without arguments, dstat assumes -cdngy by default (short for CPU, disk, network, memory pages, and system stats, respectively), and adds one line every second (execution can be interrupted anytime with Ctrl + C):
# dstat

To output the stats to a .csv file, use the –output flag followed by a file name. Let’s see how this looks on LibreOffice Calc:
I strongly advise you to check out the man page of dstat along with the man page of sysstat in PDF format for your reading convenience. You will find several other options that will help you create custom and detailed system activity reports.
Don’t Miss: Sysstat – Linux Usage Activity Monitoring Tool
Summary
In this guide we have explained how to use both native Linux tools and specific utilities provided with RHEL 7 in order to produce reports on system utilization. At one point or another, you will come to rely on these reports as best friends.
You will probably have used other tools that we have not covered in this tutorial. If so, feel free to share them with the rest of the community along with any other suggestions / questions / comments that you may have- using the form below.
We look forward to hearing from you.


An important point you want to is that sa1 and sa2 does not update the same file rather outputs different files (saXX – binary and sarXX – ascii).
nfsiostat is not part of sysstat
It is on CentOS 7. Just run
yum whatprovides “*/nfsiostat”
and you’ll see :).
i think glances is much better tool for real time monitoring providing all necessary statistics of linux server.
If you are writing about linux toolsets I guess you should have used Libre Office and not MS-Office.
@Soumitra,
If you read to the end of the article, you must have noticed that I also used Calc from the LibreOffice suite to open a file created by dstat. As for the use of MS-Excel, I am sure you will understand that we live in a world where Windows, Linux, and Mac OS X interact on a daily basis – with that in mind, I don’t think there’s anything wrong with showing how a report that you produced (as a system administrator) can be viewed by another user (a manager, for example) using a Windows system.
@Soumitra :- I think you are work free. What do you want to show ? good tutorial but you will not appreciate it, focus on how to criticize shame on you :(
As a matter of fact, I did (check the screenshots). What makes you think I used MS-Office. And even if I did, what is wrong about it?