In this article, you’ll learn how to monitor your Apache web server’s load and track requests using the mod_status module, compatible with all modern Linux distributions such as RHEL, Fedora, and Ubuntu.
What is mod_status?
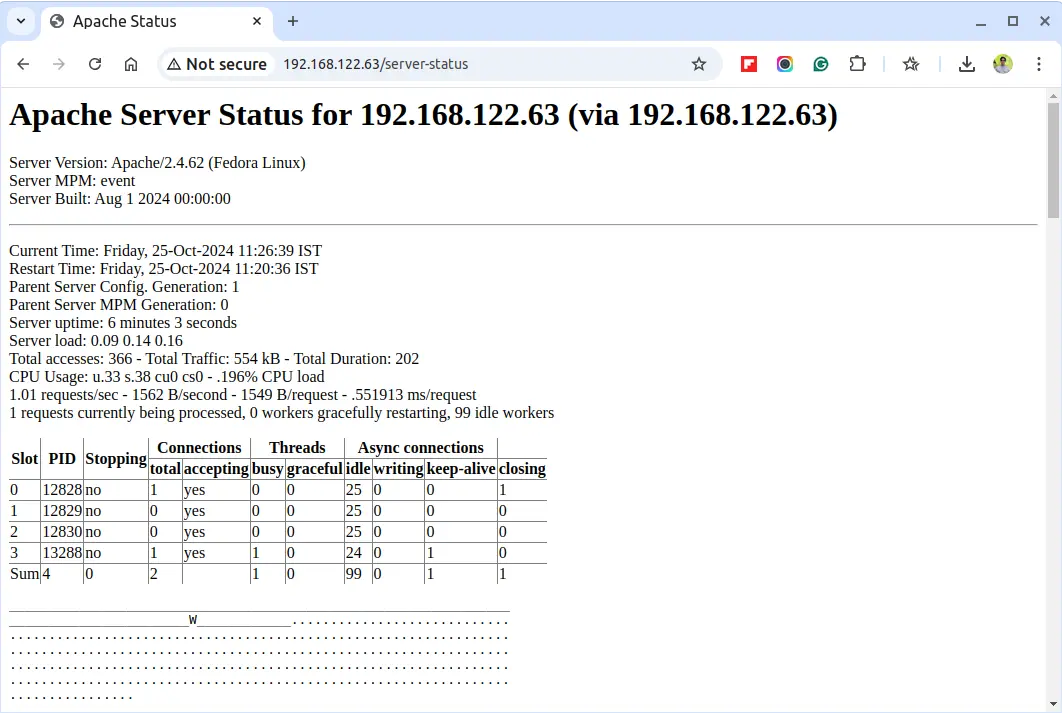
mod_status is an Apache module that provides real-time information on web server load and current connections, accessible through an HTML interface that can be viewed in a browser.
This interface displays server statistics, including:
- Total number of requests received
- Total bytes served
- CPU usage
- Server load and uptime
- Traffic stats
- Active vs. idle workers
- Process IDs of connected clients and much more.
For a live example, check out the official Apache status page at Apache Project Status Page.
Testing Environment
The steps here use the following configuration:
- Operating System: Ubuntu 22.04 / RHEL 9
- Application: Apache HTTP Server
- Document Root: /var/www/html
- Apache Config File:
/etc/apache2/apache2.conf(Debian/Ubuntu) or/etc/httpd/conf/httpd.conf(CentOS/RHEL) - Default HTTP Port: 80 TCP
Ensure Apache is installed and running on your system. If needed, refer to our guide on setting up an Apache server.
Enabling mod_status in Apache
For most modern distributions, mod_status is enabled by default and you can confirm this by running the following command.
ls /etc/httpd/modules | grep mod_status      # RHEL-based
apachectl -M | grep status                   # Debian-based
Next, open the Apache configuration file.
sudo vi /etc/httpd/conf/httpd.conf    # RHEL-based
sudo nano /etc/apache2/apache2.conf   # Debian-based
To access the server status, add or modify the following section in your Apache config file:
<Location /server-status>
    SetHandler server-status
    Require local
    Require ip YOUR_IP_ADDRESS
</Location>
To allow remote access, replace YOUR_IP_ADDRESS with your actual IP address.
If you’re using virtual hosts, repeat this configuration within each relevant <VirtualHost> section.
<VirtualHost *:80>
    DocumentRoot /var/www/html
    ServerName example.com
    <Location /server-status>
        SetHandler server-status
        Require ip YOUR_IP_ADDRESS
    </Location>
</VirtualHost>
To get more detailed metrics such as CPU load and requests per second, you can enable ExtendedStatus by adding this line in your config file.
ExtendedStatus On
After making changes, restart the Apache service to apply them:
sudo apachectl configtest
sudo systemctl restart httpd    # RHEL-based
sudo systemctl restart apache2  # Debian-based
You can now access your server’s status page by navigating to:
http://YOUR_SERVER_IP/server-status
To have it refresh automatically every few seconds, append ?refresh=5 (or any number of seconds) to the URL:
http://YOUR_SERVER_IP/server-status?refresh=5
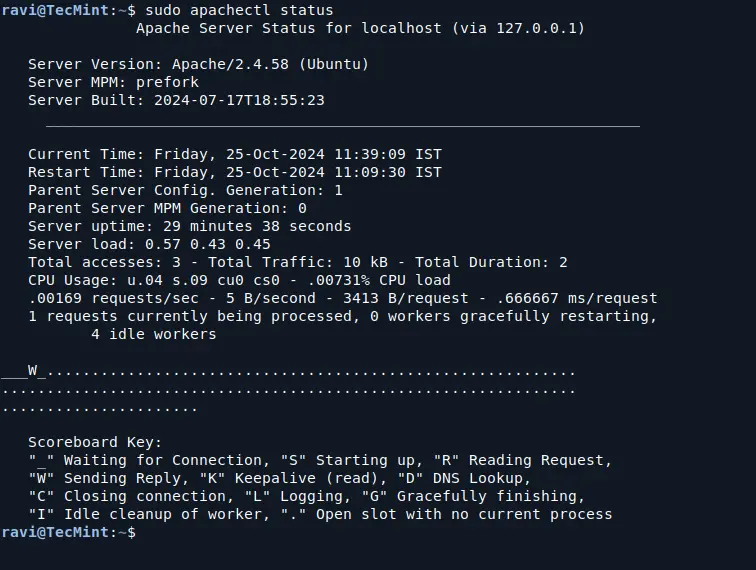
Check Apache Server Status from Command-line
To check the Apache server status from the command line, you can use the lynx – a text-based web browser.
sudo yum install lynx     # RHEL-based
sudo apt install lynx     # Debian-based
After installing, try running the apachectl command to check the Apache server status:
sudo apachectl status
This will provide a brief overview of the server’s status, including the number of requests processed, server uptime, and other important metrics.
For a more detailed view, you can use the fullstatus option:
sudo apachectl fullstatus
Conclusion
The mod_status module in Apache is a powerful, easy-to-use monitoring tool for understanding your server’s load and performance in real-time. This helps you proactively troubleshoot issues and keep your server optimized.


Thanks for sharing your thoughts on monitor.
apache load. Regards
So many errors on this page plus I use apache2 web server not httpd can you update this post?
Is there a way to just show certain parameters like memory avail on server embedded in an HTML page with other things.
I am trying to above module implement but unfortunately this modules has not installed in apache configuration.
please help me how can I install or enabled this modules. thank you
For some reason, this mod_status is not working on my machine. I referred some other sites and then comment # the line Deny from all. Then it started working. How that order works?
With Apache 2.4+ you need to replace this:
SetHandler server-status
Order allow,deny
Deny from all
Allow from all
With this:
SetHandler server-status
Require host examplde.com
How can I enable this monitoring for a server that is running with a virtual host?
You mentioned this above configuration will not work – can you reference an article on how to enable it on a machine with a virtual host?
I can get the standard page no problem, but it’s not nearly as interesting to look at as the Apache org page that is found here: http://www.apache.org/server-status
Where can one go to find out about getting the server-status page to look like this please?
https://github.com/Humbedooh/server-status
Many thanks Andy.
Add the tutorial for Debian 8 apache 2.4
@Raju,
Instructions are almost same for Debian too with slight changes to Apache locations..
Very interesting thanks..
Zabbix and a script can be used get mod_status info into Zabbix
mod_status is only for monitoring servers. I have to go onto the server to check out its status. This is very time consuming. If I want to automate this process, as in, if the server hit a certain number of request then it would send a trap or notification telling me I should look into it. Is there a way I can do this?
Tks
@Loc,
There isn’t any tool that provides such functionality, the only way is to achieve this is to via custom scripts..
Very informative tutorial!
mod_status is works well on HTTP. But When I enable redirection to port 443 by .htaccess then I get Page not found. Please let me know how I can fix this.
@Dipankar,
Have you installed SSL modules such as mod_ssl and also port 443 opened in Firewall?
Thank You.
It’s a useful module for apaches. ;)
I developed a javascript application to display data in graphs
https://github.com/dioubernardo/apacheServerStatusCharts
very cool
tags get cut off, google IfModule mod_authz_core.c
hmm, site cut of the tags …
# Apache 2.4
Require all granted
# Apache 2.2
Order deny,allow
Allow from all
Thnx for the guide!
Note that the syntax for access permissions changed from Apache 2.2 to 2.4.
Order allow,deny
Deny from all
Allow from example.com
becomes simply
Require host example.org
ref: http://httpd.apache.org/docs/2.4/upgrading.html
to make it upgrade safe, it can be written as:
# Apache 2.4
Require all granted
# Apache 2.2
Order deny,allow
Allow from all
Dear Admin I cant find this line in Apache configuration file ( LoadModule status_module modules/mod_status.so ) but i insert manually than i acces through ip and hostname I have no access error? could you tell me whay i #LoadModule line cant find
I tried to add my IP as well into allowed list, but still getting error:
You don’t have permission to access /server-status on this server
Kindly guide for the solution
@Amrita,
Are you able to access page from localhost? which OS and Apache version you’re using?
Awesome page..thanks for your help
Very useful , please post more on web server administration & tuning for better performance.
Thank you
Hi
I am trying to enable mod_status, I follow all steps very carefully, but not getting expected result; when I try to access http://IP-address/server-status
face following error:
404 Ooops…It looks like the page your are looking for does not exist
more over there is no file or folder name server-status in DocumentRoot location;
any idea, I think there should some script in DocumentRoot location that will be called and display a result…
please help me if you know the reason of this problem;
thanks
sani
when I stop all my virtual hosts, http://IP-address/server-status worsk fine, and when I put
SetHandler server-status
Order deny,allow
Deny from all
Allow from 127.0.0.1
inside virtual host ,it gave me 404 Ooops…It looks like the page your are looking for does not exist
its very urgent please help
thanks in advance;
sani
Is this works for windows machine , Because i did the changes its not working properly,
If the web server is listening only on port 8443 (https), how can I configure the server-status page?
Doesn’t matter which port you are using for Apache, just enable the server-status module as suggested in the article..that’s it..
is there any way to get this info in json format with bash ?
I have configured server-status likewise. But its showing the following error.
Forbidden:
you don’t have permission to access /server-status on this server.
Please help me.
Please add your system IP in allow list, for example see the following entry.
I’ve seen many statistics data with the url “http://192.168.114.161/server-status” ,like Server Version,Server Built,,Current Time,Restart Time,Parent Server Generation,Server uptime,Total accesses , but i couldn’t find the “CPU Usage”, i can’t find out what’s wrong,can you help me?
If you are writing about accessing server-status from console, check out apachetop too: https://code.google.com/p/apachetop/