Brief: In this guide, we will discuss the best tools for monitoring and debugging disk I/O activity (performance) on Linux servers.
A key performance metric to monitor on a Linux server is disk I/O (input/output) activity, which can significantly impact several aspects of a Linux server, particularly the speed of saving to or retrieving from disk, of files or data (especially on database servers). This has a ripple effect on the performance of applications and services.
1. iostat – Shows Device Input and Output Statistics
iosat is one of the many terminal-based system monitoring utilities in the sysstat package, which is a widely used utility designed for reporting CPU statistics and I/O statistics for block devices and partitions.
To use iostat on your Linux server, you need to install the sysstat package on your Linux system by running the applicable command for your Linux distribution.
sudo apt install sysstat          [On Debian, Ubuntu and Mint]
sudo yum install sysstat          [On RHEL/CentOS/Fedora and Rocky Linux/AlmaLinux]
sudo emerge -a app-admin/sysstat  [On Gentoo Linux]
sudo apk add sysstat              [On Alpine Linux]
sudo pacman -S sysstat            [On Arch Linux]
sudo zypper install sysstat       [On OpenSUSE]
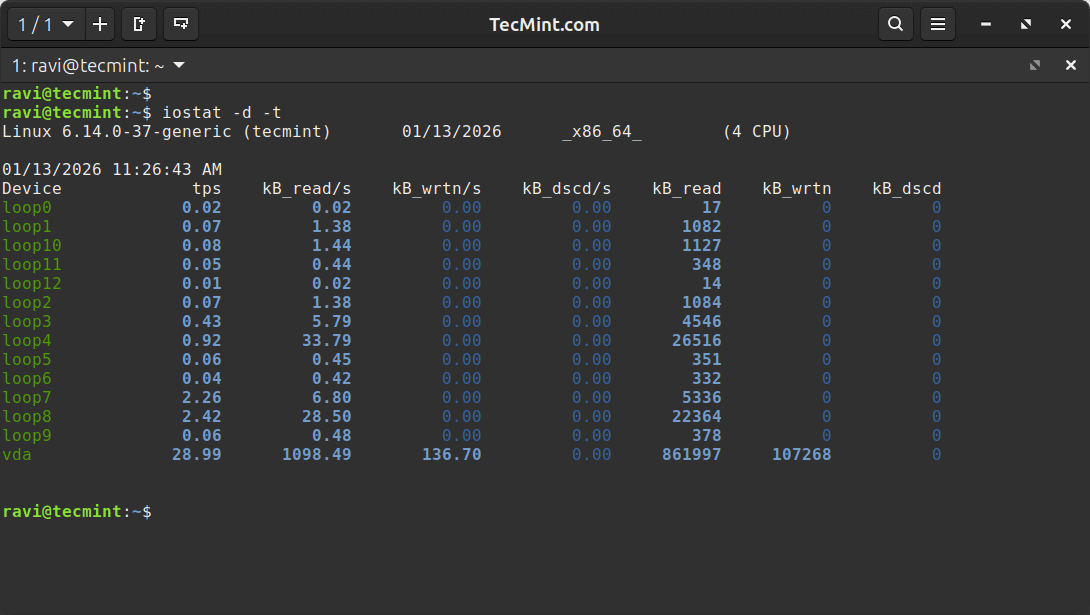
To show a simple device utilization report, run iostat with the -d command line option. Usually, the first report provides statistics about the time since the system startup (boot time), and each subsequent report is concerned with the time since the previous report.
Use the -x for an extended statistics report and the -t flag to enable time for each report. Besides, If you wish to eliminate devices without any activity in the report output, add the -z flag:
iostat -d -t
OR
iostat -d -x -t
To display statistics in kilobytes per second as opposed to blocks per second, add the -k flag, or use the -m flag to display stats in megabytes per second.
iostat -d -k
OR
iostat -d -m
iostat can also display continuous device reports at x second intervals. For example, the following command displays reports at two-second intervals:
iostat -d 2
Related to the previous command, you can display n number of reports at x second intervals. The following command will display 10 reports at two-second intervals.
iostat -d 2 10
Alternatively, you can save the report to a file for later analysis.
iostat -d 2 10 > disk_io_report.txt &
For more information about the report columns, read the iostat man page:
man iostat
2. sar – Show Linux System Activity
sar is another useful utility that ships with the sysstat package, intended to collect, report, or save system activity information. Before you can start using it, you need to set it up as follows.
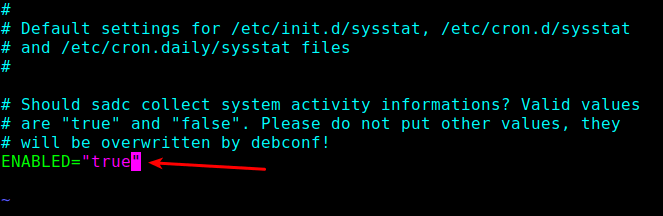
First, enable it to collect data in the /etc/default/sysstat file.
sudo vi /etc/default/sysstat
OR
sudo nano /etc/default/sysstat
Look for the following line and change the value to “true” as shown.
ENABLED="true"
Next, you need to reduce the data collection interval defined in the sysstat cron jobs. By default, it is set to every 10 minutes; you can lower it to every 2 minutes.
You can do this in the /etc/cron.d/sysstat file:
sudo vi /etc/cron.d/sysstat
OR
sudo nano /etc/cron.d/sysstat
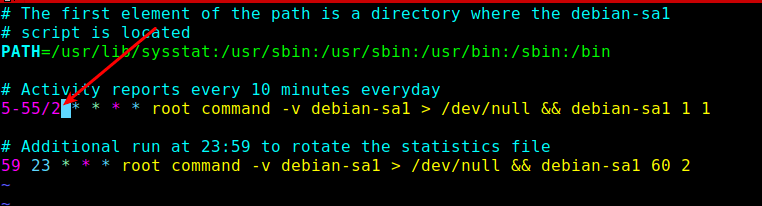
Save the file and close it.
Finally, enable and start the sysstat service using the following systemctl command:
systemctl enable --now sysstat.service
systemctl start sysstat.service
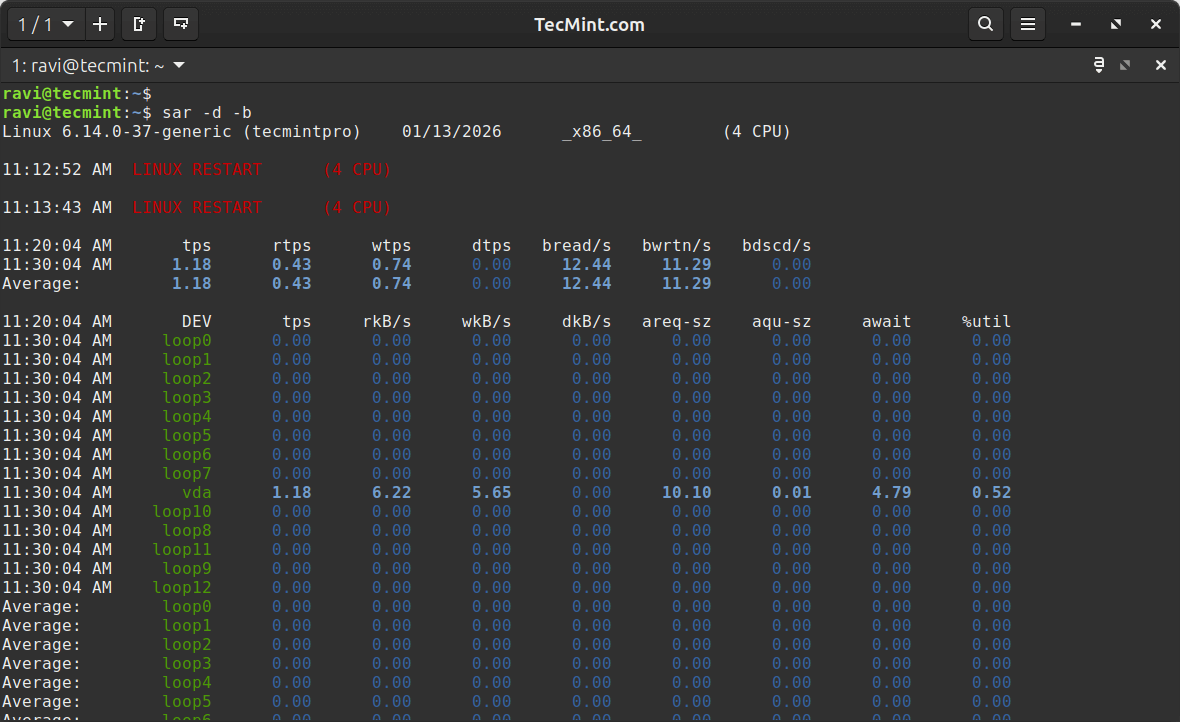
Next, wait for 2 minutes to start viewing sar reports. Use the sar command and the -b command line option to report I/O and transfer rate statistics and -d to report activity for each block device, as shown.
sar -d -b
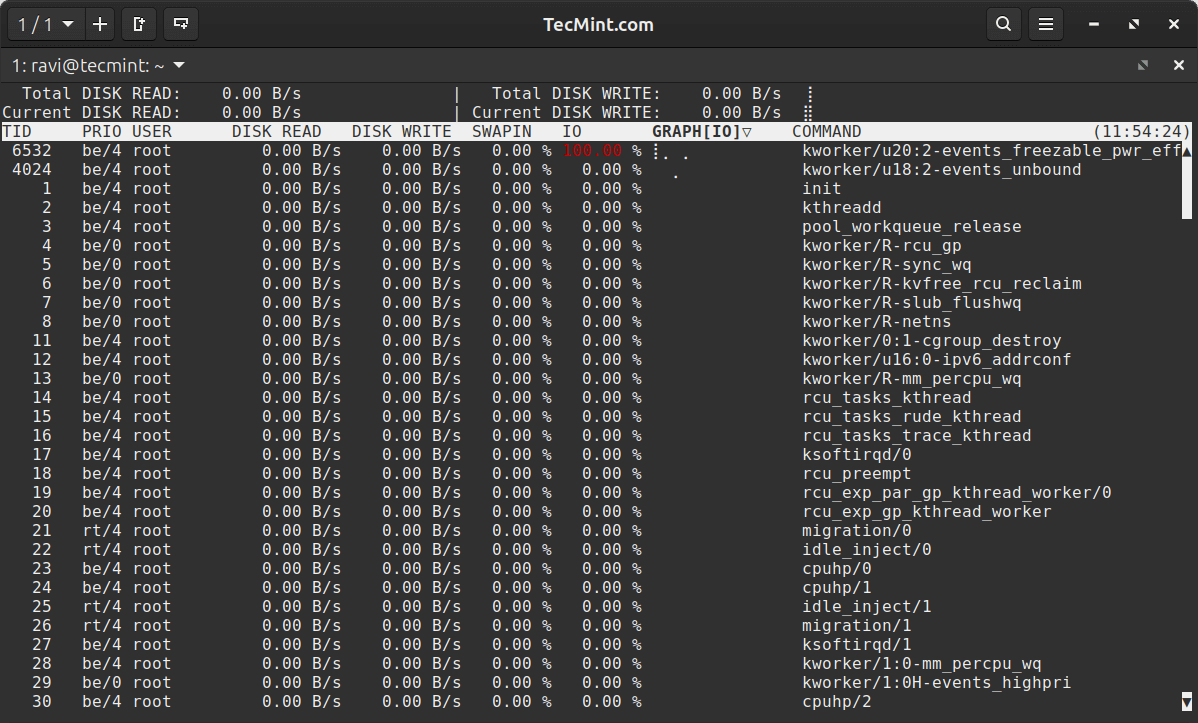
3. iotop – Monitor Linux Disk I/O Usage
Similar to the top monitoring tool in terms of design, iotop is a simple utility that enables you to monitor disk I/O activity and usage on a per-process basis.
You can get it installed on your Linux server as follows (remember to run the appropriate command for your Linux distribution):
sudo apt install iotop             [On Debian, Ubuntu and Mint]
sudo yum install iotop             [On RHEL/CentOS/Fedora and Rocky Linux/AlmaLinux]
sudo emerge -a sys-process/iotop   [On Gentoo Linux]
sudo apk add iotop                 [On Alpine Linux]
sudo pacman -S iotop               [On Arch Linux]
sudo zypper install iotop          [On OpenSUSE]
To monitor per-process I/O activity, you can run iotop without any arguments as follows. By default, the delay between iterations is 1 second. You can change this using the -d flag.
iotop
OR
iotop -d 2
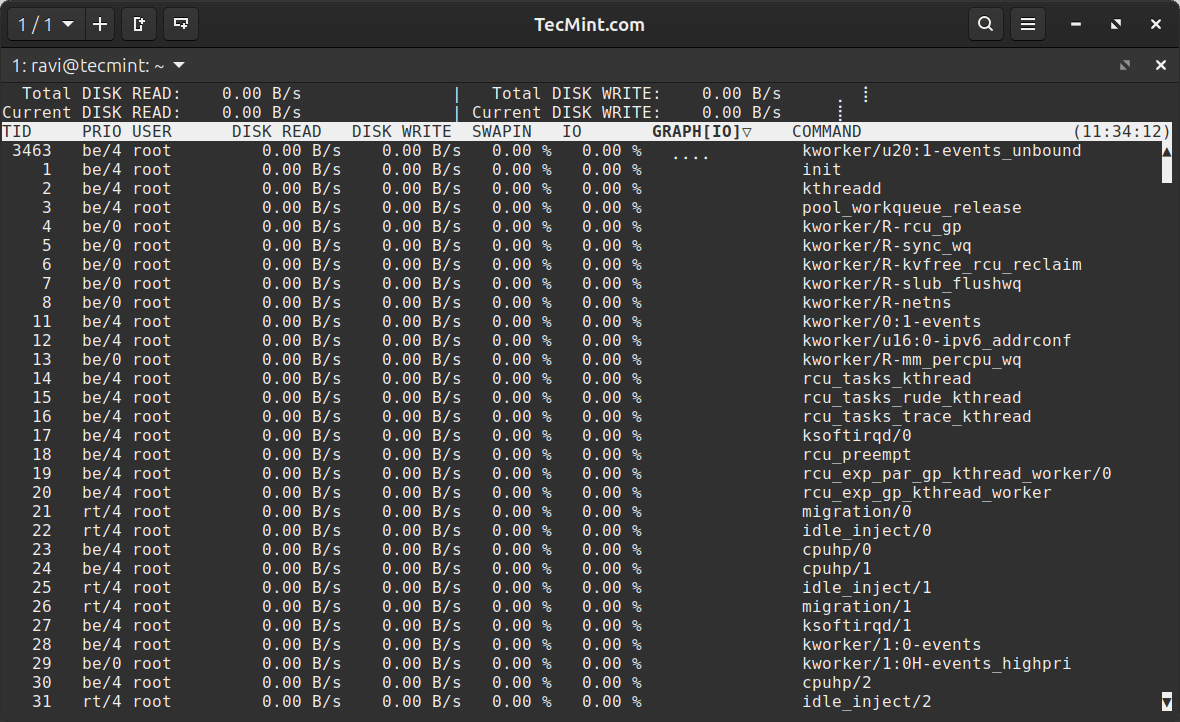
iotop will by default display all threads of a process. To change this behavior so that it only shows processes, use the -P command line option.
iotop -P
Also, using the -a option, you can instruct it to display accumulated I/O as opposed to showing bandwidth. In this mode, iotop shows the amount of I/O processes performed since iotop was invoked.
iotop -P -a
4. dstat – Versatile Real-Time Resource Statistics
Important Update: dstat development has been officially terminated by the original developer. Due to actions taken by RedHat to hijack the DSTAT name, the original maintainer has ceased development and now recommends using dool as the successor project, which maintains full compatibility with dstat commands while continuing active development.
If you still want to use dstat (it continues to work on most systems), you can install it as shown below. However, we strongly recommend migrating to dool for ongoing support and updates.
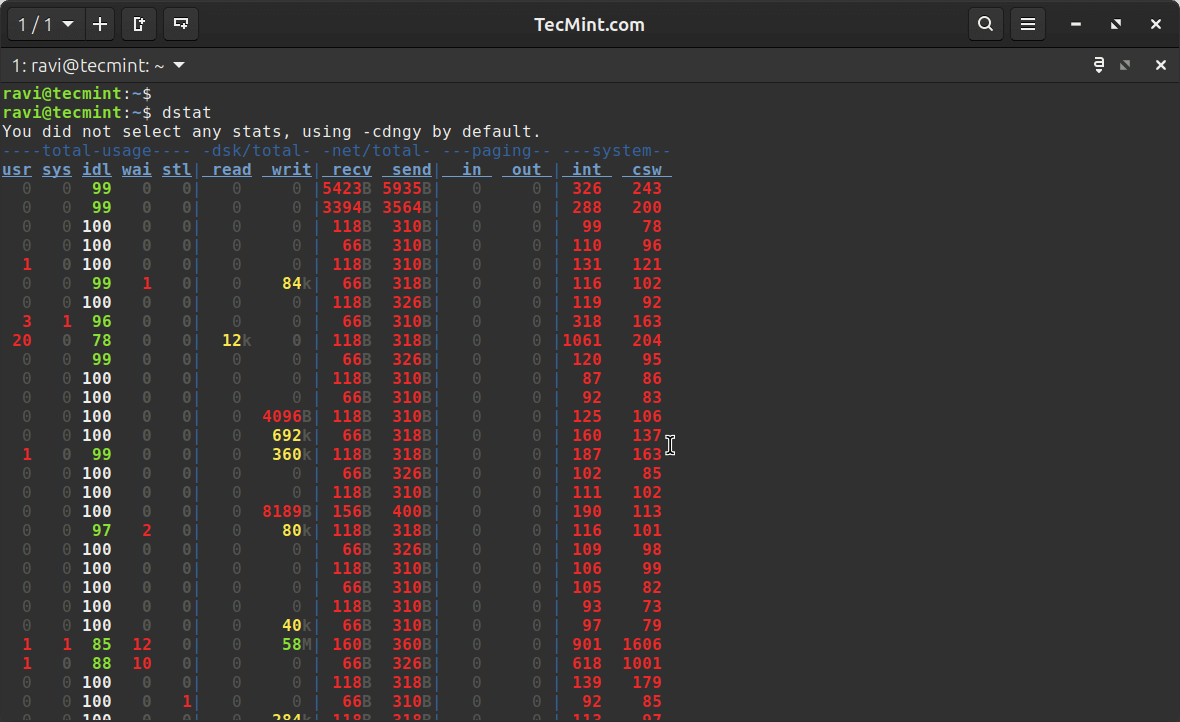
dstat is a powerful all-in-one replacement for older tools like vmstat, iostat, netstat, and others. It provides real-time stats for various system resources, including CPU, disk, memory, and network, in a clean, color-coded format.
To install dstat, use the relevant command for your Linux distro:
sudo apt install dstat             # On Debian, Ubuntu, and Mint
sudo yum install dstat             # On RHEL, CentOS, Fedora, Rocky Linux, AlmaLinux
sudo emerge -a sys-process/dstat   # On Gentoo Linux
sudo apk add dstat                 # On Alpine Linux
sudo pacman -S dstat               # On Arch Linux
sudo zypper install dstat          # On OpenSUSE
To run it with default settings (which includes CPU, disk, and network I/O):
dstat
If you want to focus only on disk activity, use:
dstat -d
You can also mix and match different options. For example, to monitor CPU, memory, and disk:
dstat -cdm
To log output to a CSV file for later analysis:
dstat -cdm --output system_stats.csv
dstat is super flexible and great for getting a quick, holistic view of your system in real time.
5. dool – Modern Successor to dstat
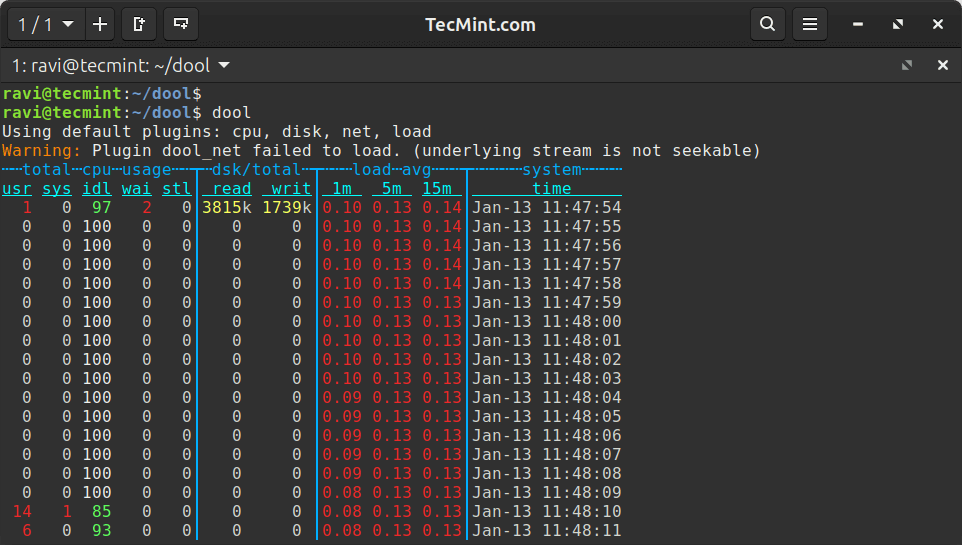
dool is the actively maintained fork of dstat, created after the original dstat project was terminated. It maintains 100% compatibility with dstat commands while adding new features and bug fixes.
dool (dstat-compatible tool) is the recommended choice for new deployments and provides the same powerful, real-time system monitoring capabilities you’re used to with dstat.
On most modern Linux distributions, you can install dool from the source:
git clone https://github.com/scottchiefbaker/dool.git
cd dool
sudo ./install.py
The great news is that dool uses the exact same syntax as dstat, so if you’re familiar with dstat, you already know how to use dool.
To run it with default settings:
dool
Focus only on disk activity:
dool -d
Monitor CPU, memory, and disk together:
dool -cdm
6. atop – Advanced System and Process Monitor
atop is like top, but on steroids, which gives you detailed, per-process resource usage, including disk I/O, memory, CPU, and network, making it great for in-depth analysis, especially when diagnosing performance issues over time.
Install it using your distro’s package manager:
sudo apt install atop             # On Debian, Ubuntu, and Mint
sudo yum install atop             # On RHEL, CentOS, Fedora, Rocky Linux, AlmaLinux
sudo emerge -a sys-process/atop   # On Gentoo Linux
sudo apk add atop                 # On Alpine Linux
sudo pacman -S atop               # On Arch Linux
sudo zypper install atop          # On OpenSUSE
To launch it:
atop
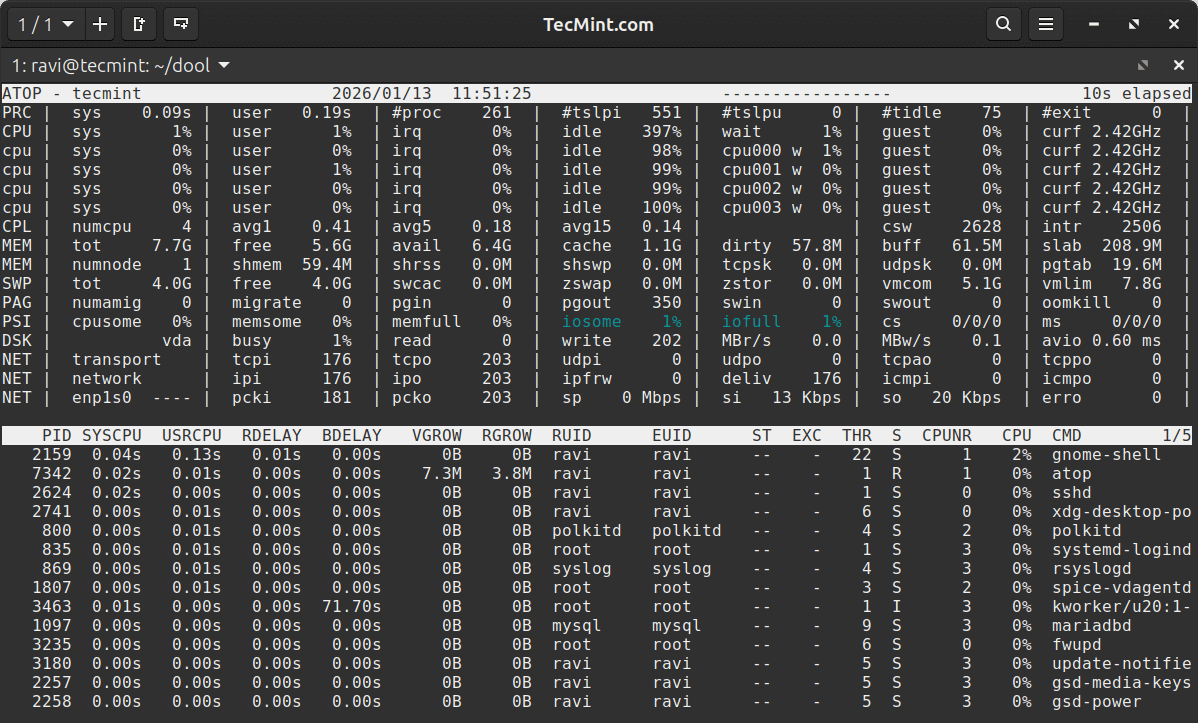
By default, it updates every 10 seconds. You can change the interval like this:
atop 2
One of its best features is that it records data to a log file automatically (usually in /var/log/atop/).
atop -r /var/log/atop/atop_YYYYMMDD
It’s especially useful for tracing performance issues after they’ve already happened.
7. iotop-c (iotop Alternative)
While the original iotop is great, there’s a newer alternative called iotop-c that’s written in C instead of Python, which makes it significantly faster and more resource-efficient.
sudo apt install iotop-c             # On Debian, Ubuntu, and Mint
sudo yum install iotop-c             # On RHEL, CentOS, Fedora, Rocky Linux, AlmaLinux
sudo pacman -S iotop-c               # On Arch Linux
To run it:
iotop-c
It has the same interface as iotop but with better performance, especially on systems with many processes doing I/O operations. Use it the same way you’d use regular iotop, but expect faster updates and lower overhead.
All the familiar iotop flags work the same way:
iotop-c -P          # Show processes only, not threads
iotop-c -a          # Show accumulated I/O
iotop-c -d 2        # Update every 2 seconds
That’s all we had for you! We would like to know your thoughts about this guide or the above tools. Leave a comment via the feedback form below.
You can also inform us about tools that you think are missing in this list, but deserve to appear here.


A little typo: “iosat”
@Jeff,
Good catch, thanks for pointing that out!
It’s been fixed.
Hello Aaron,
Thanks for your great article. I’ve not used the sysstat package before. It’s just what I’ve
been looking for.
In the section on enabling and starting the sysstat reporting service, I believe you have a typo in the second command. I believe the first command should be
systemctl enable --now sysstat.serviceand the second should besystemctl start sysstat.service.I also see your article on dool. I’ll give that a read next.
Thanks again!
@Larz
Thanks so much for your kind words and for catching that typo, great eye!
You’re absolutely right about the command sequence. I’ve just updated the article to reflect the correct usage.