This 4-part series will explain six key performance metrics to monitor in a Linux server. By the end of this series, you will understand what factors in a Linux system you need to look out for that contribute to the overall system performance and also their relative importance.
Is your Linux server slow or are applications hosted on it showing unexpected behavior or signs of sluggish performance? Many factors in a Linux server affect its overall performance or the performance of applications hosted on it.
But there are a few key metrics you need to track that can impact the most critical things such as response time or execution time of processes, throughput – the total amount of work the server can do in a given time, and much more.
Let’s look at the first two key performance metrics in this first part of the series.
[ez-toc]
1. Linux CPU Utilization
Being the system’s brain, a properly functioning CPU is a critical part of your Linux server or any computer. Therefore CPU usage is one of the essential aspects to track in a Linux server, which is used to gauge system performance in terms of throughput.
There are several command-line-based and graphical user interface tools for monitoring CPU usage on a Linux system such as top, glances (my favorite), htop, and more.
Glances – Linux Monitoring Tool
Glances is an open-source real-time monitoring utility that monitors several aspects of your Linux system such as CPU, memory, disk, and network usage.
To install glances on your Linux distribution, run:
$ sudo apt install glances             [On Debian, Ubuntu and Mint]
$ sudo yum install glances             [On RHEL/CentOS/Fedora and Rocky/AlmaLinux]
$ sudo emerge -a sys-process/glances   [On Gentoo Linux]
$ sudo apk add glances                 [On Alpine Linux]
$ sudo pacman -S glances               [On Arch Linux]
$ sudo zypper install glances          [On OpenSUSE]
The following is a screenshot of a section of the glances monitoring tool on a Debian Linux server showing CPU utilization statistics.
# glances
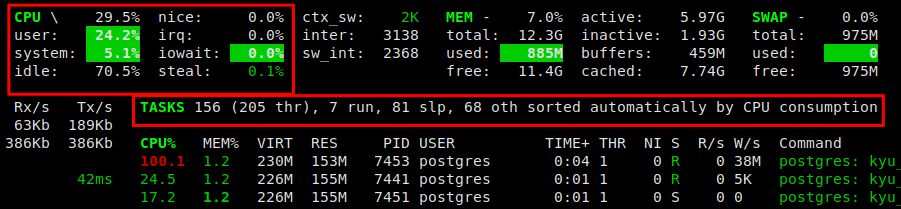
Here the overall CPU usage is 29.5 percent, and more CPU time is utilized by user space processes or applications. It shows the total number of tasks (156), the number of tasks running (7), the number of tasks in sleep mode (81), and others. It also shows a list of processes by CPU consumption by default.
Top – Monitor Linux Processes
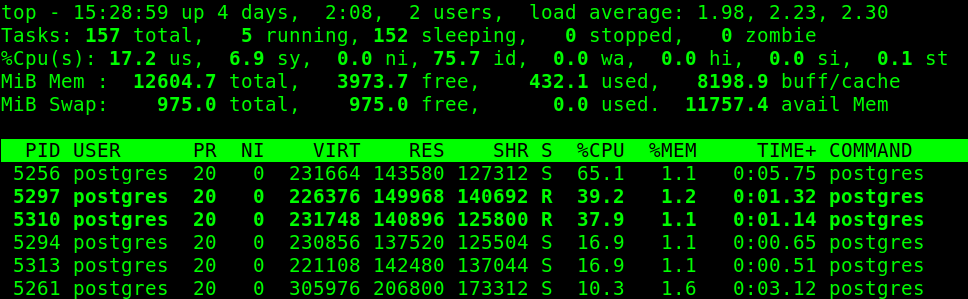
The top command provides a dynamic real-time view of all the running processes in the Linux system along with CPU and memory utilization.
# top
htop – Linux Process Viewer
htop is an interactive Linux system process viewer and process manager that shows the information on all the running processes by the CPU and memory usage on a system.
To install htop on your Linux distribution, run:
$ sudo apt install htop             [On Debian, Ubuntu and Mint]
$ sudo yum install htop             [On RHEL/CentOS/Fedora and Rocky/AlmaLinux]
$ sudo emerge -a sys-process/htop   [On Gentoo Linux]
$ sudo apk add htop                 [On Alpine Linux]
$ sudo pacman -S htop               [On Arch Linux]
$ sudo zypper install htop          [On OpenSUSE]
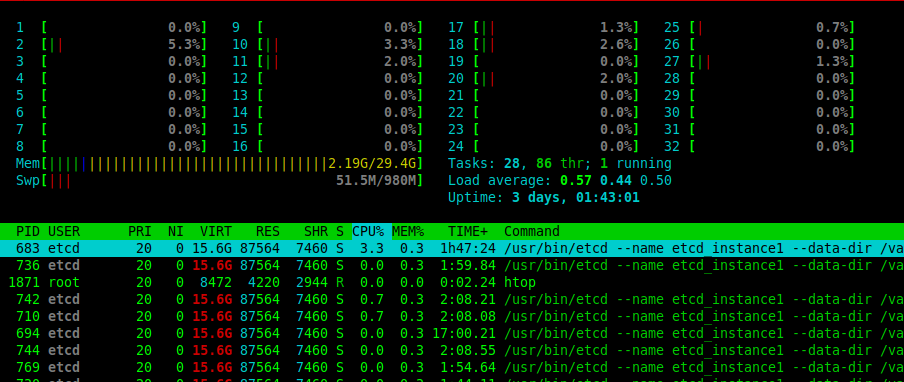
The following is a screenshot of a htop monitoring tool, which shows a list of running processes by CPU Usage.
# htop
Based on the figures you have seen in the previous screenshots, the CPU usage metric is divided into three main categories or states:
- user – indicates the percentage of CPU time used by user space processes.
- system – shows the percentage of CPU time used by the kernel.
- idle – shows the percentage of CPU time not actively being used.
Additionally, there are also the following CPU sub-states:
- nice – is a subset of the user state which indicates the percentage of CPU time occupied by user-level processes with a positive nice value (lower scheduling priority than other processes).
- irq or hi – shows the percentage of CPU time spent servicing hardware interrupts.
- softirq or si – shows the percentage of CPU time spent servicing software interrupts.
- iowait or wa – a subset of the idle state that shows the percentage of CPU time spent waiting for I/O operations such as reading and writing to or from disk.
- steal – shows the percentage of CPU time taken by a virtual CPU in a hypervisor to involuntarily wait for a physical CPU for processing time.
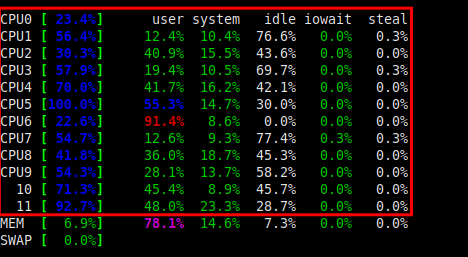
Monitor Linux CPU Core Utilization
If your server has more than one processor (sometimes called a multi-core system), you can also monitor the utilization of each core. In glances, simply press 1 to have a view like the one shown in the next screenshot.
You can also run the following command to find the total number of processors in your server:
# cat /proc/cpuinfo | grep ^processor
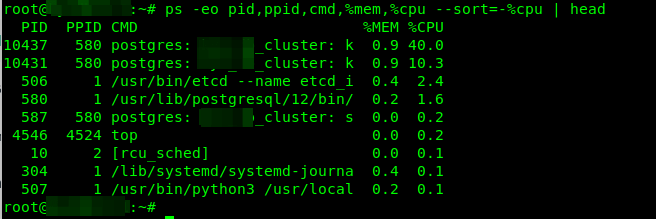
To find the top running processes by CPU usage, run the following ps command:
# ps -eo pid,ppid,cmd,%mem,%cpu --sort=-%cpu | head
2. Monitor Linux System CPU Load
The CPU load is the number of processes/threads that are using or want to use CPU time. On Linux, not only is it about runnable tasks (not blocked by anything, ready to run on the CPU or waiting in the run queue) but also tasks in the uninterruptible sleep state, for example, a process waiting for an I/O operation to complete or other things.
It is not the same as the CPU usage we have covered above. Load average is the average system load over some time, usually one, five, and fifteen minutes in Linux. Your system is idle if the load averages are 0.0.
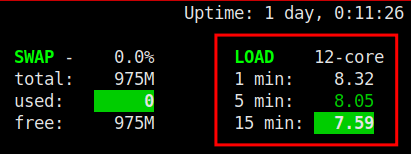
If you have a multi-core server with 12 cores and a load average of 8.32 as shown in the following screenshot, it means the CPU is working under capacity and it can take more load. In case the load average is 12, it implies full capacity.
# glances
On the other hand, a load average that is greater than the total number of CPU cores indicates that processes are queuing – the load is increasing. The following screenshot shows a system that is unhealthy, it is overloaded.
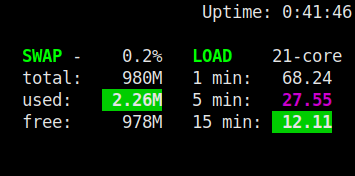
Remember that in case the 1-minute average is higher than the 5- or 15-minute average, like is the case in the previous example (68.24, 27.55, 12.11), then it’s an indicator that the CPU load is shooting up. But if the 1-minute average is lower than the 5 or 15-minute average, then the load is going down.
You can also use the uptime or w command to view load averages. In this example, the load is increasing.
# uptime
OR
# w

Causes of High CPU Usage or CPU Load
Some of the most common causes of high or extremely high CPU include running multiple CPU-intensive applications/services on the same server (with low resource specifications), and malware designed to replicate themselves over and over to deplete system resources. Streaming and gaming applications can also cause extremely high CPU usage and CPU load when traffic is high.
Besides, DoS or DDoS attacks can trigger an absurdly high number of connections and requests to hosted applications requiring additional complex calculations by the CPU. Bugs or unoptimized code in applications can sometimes bring about infinite loops that can exhaust available CPU time.
Note: It is possible to have a low CPU usage percentage yet a very high system or CPU load. Such a situation can be caused by having lots of threads in an uninterruptible sleep state plus normal CPU demand.
Effects of High CPU Usage or CPU Load
If your system is overloaded, CPU-intensive applications might freeze or crash, other running applications might become slow and eventually stop responding to user input; automated jobs such as backups and system alerts can fail and applications might open at a snail’s pace or not open at all, and so much more.
Minimizing High CPU Usage and CPU Overload
The following are some ways to address high CPU usage or system load in Linux servers:
- Quickly add more CPUs, especially in virtual environments.
- Restart CPU-intensive applications where necessary.
- Stop/disable unused services/applications.
- Check for bugs or unoptimized code in user applications that can result in infinite loops.
- Limit the number of connections or requests allowed in web servers, application servers, and database systems to mitigate DoS or DDoS attacks.
- Reboot the server where necessary if it starts to freeze.
- Use scripts or monitoring applications to set up system alerts that are triggered when CPU usage is abnormally high.
That’s all for now. In the next part of this series, we will cover how to monitor memory utilization on a Linux server. Until then, stay with us.


You can’t install glances on Debian 11 using apt. Use pip instead! Just make sure you got the dependencies right.
and then: