Iotop is an open source and free utility similar to top command, that provides an easy way to monitor Linux Disk I/O usage details and prints a table of existing I/O utilization by process or threads on the systems.
Iotop tool is based on Python programming and requires Kernel accounting function to monitor and display processes. It is very useful tool for system administrator to trace the specific process that may causing a high disk I/O read/writes.
Iotop Pre-requisites
- Kernel 2.6.20 or higher
- Python 2.7 or higher
This article explains how to install iotop program to monitor and trace Linux device I/O (input/output) on a per-process basis in Linux systems.
Install Iotop Disk I/O Monitoring Tool in Linux
As I already said above that iotop requires latest Kernel 2.6.20 and Python 2.7, let’s first update both of them with the help of following command.
-------------- On RHEL, CentOS and Fedora --------------
# yum update

-------------- On Fedora 22+ Releases --------------
# dnf update

-------------- On Debian, Ubuntu and Linux Mint --------------
# apt-get update
Next, verify your kernel and python version by running:
# uname -r
# python -V
Important: At the time of this writing, CentOS/RHEL 5.x uses an older version of python and not possible to install iotop. However, they can use dstat program, which does a similar function of iotop.
Install iotop using Package Manager
To install iotop from your package manager, select the appropriate command from the following list.
-------------- On RHEL, CentOS and Fedora --------------
# yum install iotop

-------------- On Fedora 22+ Releases --------------
# dnf install iotop

-------------- On Debian, Ubuntu and Linux Mint --------------
# apt-get install iotop
Important: Installing iotop from your default repositories will give you an older version. If you looking to have a most recent version of iotop, consider compiling from source using following instructions.
Install iotop from Source
To install most recent version of iotop, go the official project page and download the latest source package and compile it from source using following series of commands:
# wget http://guichaz.free.fr/iotop/files/iotop-0.6.tar.bz2
# tar -xjvf iotop-0.6.tar.bz2
# cd iotop-0.6/
# ./setup.py install
Important: You can run iotop within the directory i.e. (by running ./iotop.py) or you can run the installer ./setup.py install command to install iotop under /usr/bin:
How to Use iotop in Linux
At its easiest you can execute iotop without any arguments as shown.
# iotop
You should get a list of running processes along with information about their current disk I/O usage:
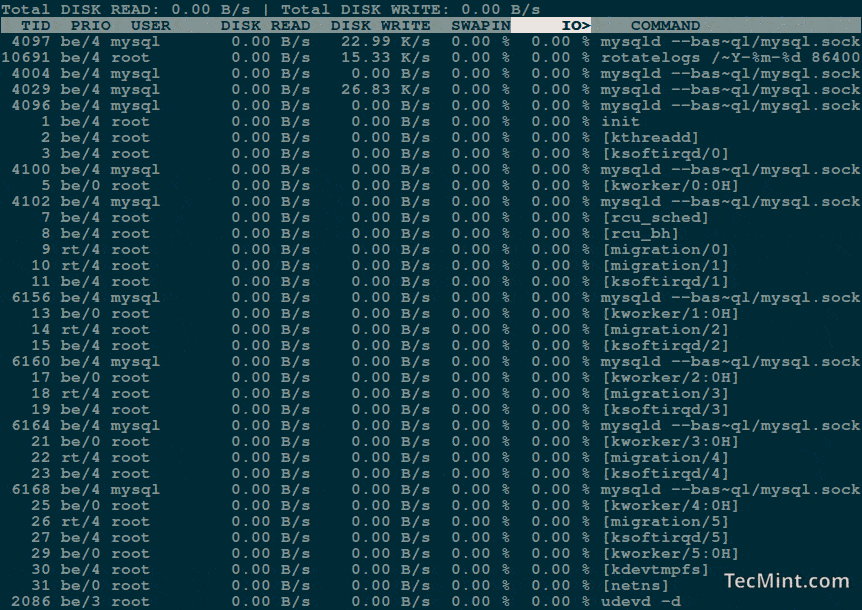
The each column heading is self-explanatory, but there are two important things to consider here:
- IO – The “IO” column display total I/O (disk and swap) usage for each process.
- SWAPIN – The “SwapIn” column displays swap usage for each process.
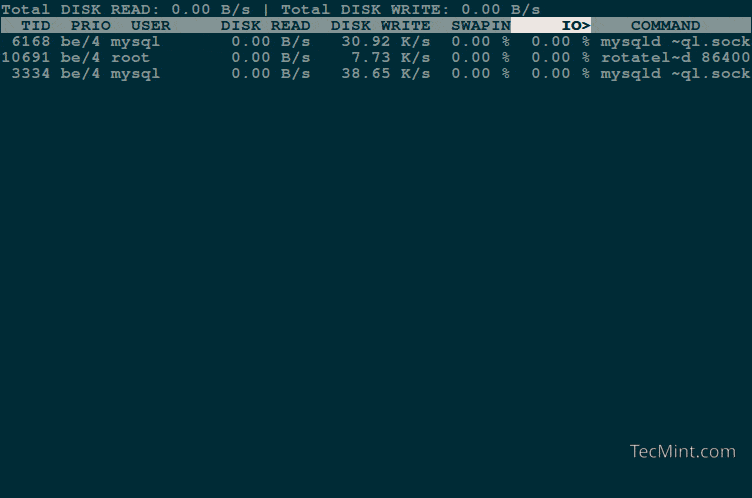
I recommend start using iotop with -o or –only option to see current processes or threads actually doing I/O, instead of watching all processes or threads.
# iotop --only
Get Alerts On Linux Disk I/O Activity
You can use cron job scheduling program to run iotop every minute to track any I/O activity it detects and send an alert to your email address.
# vi /etc/cron.d/iotop
And add the following lines into file:
[email protected]
* * * * * root iotop -botqqq --iter=3 >> /var/log/iotop
If you want, you can tweak the above command as per your requirements.
To know more usage and options about iotop program, run the following command to check the man pages.
# man iotop
Some important iotop usage and keyboard shortcuts.
- Move left or right arrow key to change the sorting.
- Use –version option to see version number and exit.
- Use -h option to see information of usage.
- Use -r option to reverse the sorting order.
- Use -o option to check processes or thread.
- Use -b option to Turn On non-interactive mode to enable logging I/O usage.
- Use -p PID to list all processes/threads to monitor.
- Use -u USER option to list all the users to monitor.
- Use -P option to list only processes. Normally iotop displays all threads.
- Use -a option to check accumulated I/O instead of bandwidth.
All the above iotop options are fairly straightforward. The interface almost looks and functions exactly same as Linux top command.
Iotop can be extremely handy in tracking down Linux process which are using high swap memory usage or is causing an high amount of disk IO activity.


iotop is great for showing ‘now’ but if you want historical disk usage data, use sar — you’ll be able to pull up disk and other activity going back as long as you keep logs.
Hi,
As far as disk I/O in linux is concerned. We need to first go through several operating system concepts, which will help us in finding out performance bottlenecks.
Concepts like Minor Page fault and Major Page fault are very important. The number of major page fault is very helpful in finding the IO usage.
http://www.slashroot.in/linux-system-io-monitoring