atop is a full-screen performance monitoring tool that provides detailed reports about all system processes, including those that have already terminated. It does this by continuously logging system activity at regular intervals, storing that information for later use.
These logs can be used for various purposes such as system analysis, performance tuning, identifying bottlenecks, debugging issues, or tracing the cause of an unexpected overload.
Unlike traditional tools like top or htop, which only show live system data, atop gives you the ability to look back in time and inspect exactly what was happening during any logged interval, which makes it especially valuable for system administrators for keeping servers running smoothly.
In this article, we will cover what atop offers, how to install it on popular Linux distributions, and how to use it effectively to monitor and analyze your system’s performance history.
What is Atop?
atop is a full-screen system and process monitor for Linux, which is designed to report system-wide and per-process activity, including:
- See all running and completed processes.
- Monitor CPU, memory, disk, and network usage per process.
- Log all activity in binary files for later analysis.
- Detect zombie and orphan processes.
- Display thread-level resource usage.
- Monitor per-user and per-program activity.
- Show pressure stalls (PSI) for CPU/memory/disk in modern kernels.
- Support for cgroup v2, perfect for containerized environments.
- Optional integration with Netatop for per-process network stats.
And what makes atop stand out: it can log all this activity to disk at regular intervals (default is every 10 minutes). You can then replay any part of the system history and dig into what happened.
This is a huge win when you need to debug random crashes, track down resource abuse, or monitor usage over time, especially for headless servers or production systems.
Installing Atop Monitoring Tool on Linux
atop is available in most Linux distribution repositories, you can either install it using your system’s package manager or compile it from source for the latest version.
On RHEL/CentOS/Fedora
First you will need to enable epel repository under RHEL-based distributins, in order to install atop monitoring tool.
sudo dnf install epel-release
After you’ve enabled epel repository, you can simply use the yum package manager to install the atop package as shown below.
sudo dnf install atop
On Debian/Ubuntu
Under Debian-based distributins, atop can be installed from the default repositories using the apt command.
sudo apt-get install atop
On Arch Linux / Manjaro
If you’re using a rolling-release distro like Arch or its derivatives, installing atop is just one command away:
sudo pacman -S atop
Installing atop from Source (Optional)
If you want the latest version (for example, if the repo version is outdated or you want bleeding-edge features), you can build atop from source.
wget https://www.atoptool.nl/download/atop-2.12.0.tar.gz
tar -xzf atop-2.12.0.tar.gz
cd atop-2.12.0
make
sudo make install
Note: You may need development tools installed like build-essential (Debian) or gcc, make, etc., depending on your distro.
Once atop is installed, we need to enable its background logging service, so it can start collecting performance data automatically on boot.
sudo systemctl enable --now atop
sudo systemctl enable --now atop-rotate.timer
Getting Started with atop in Linux
Once you’ve installed atop and enabled its logging service, launch it in your terminal:
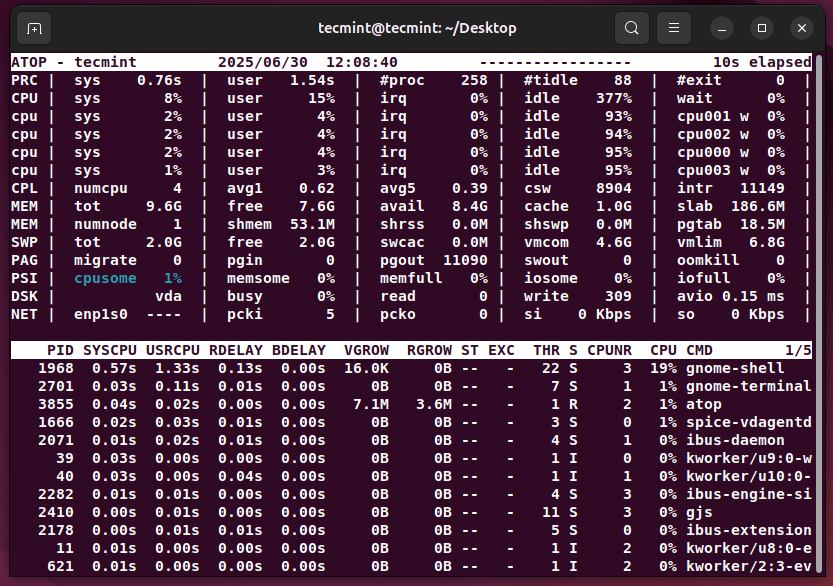
atop
You’ll then see a dynamic, colorized interface similar to top, refreshing by default every 10 seconds.
Customizing the Log Interval (Default: 600 Seconds)
By default, atop logs system activity every 600 seconds (i.e., 10 minutes), which might be sufficient for general monitoring, it’s often too infrequent for effective troubleshooting, especially when you’re chasing down short-lived spikes in resource usage or debugging performance bottlenecks.
sudo sed -i 's/600/60/' /etc/atop/atop.daily    [Under RedHat based systems]
sudo sed -i 's/600/60/' /etc/default/atop       [Under Debian based systems]
After making this change, atop will start collecting logs every minute, giving you a much clearer picture of system behavior over time, which is particularly useful when diagnosing intermittent issues, analyzing trends, or monitoring servers under heavy load.
View Scheduling Information (s key)
To get insight into how the kernel is scheduling processes, press the s key, which will display how much CPU time each is consuming and how long they’ve been in a “running” state.
atop -s
Analyze Memory Usage (m key)
By pressing the m key, you get a comprehensive view of memory usage for all running processes. The VSIZE column shows the total virtual memory allocated, while RSIZE indicates the portion of memory that is currently resident in RAM.
Additionally, VGROW and RGROW display how much virtual and resident memory a process has gained or lost during the current interval. The MEM column shows the overall percentage of memory used by each process.
atop -m
Monitor Disk Utilization (d key)
Disk I/O is a common bottleneck in many systems, and atop makes it easy to monitor with the d key, which shows disk activity at the system level, including Logical Volume Management (LVM) stats and per-disk performance.
The RDDSK and WRDSK columns show the amount of data being read and written (in KB/s), while DSK and LVM columns help identify which volumes or disks are most active.
atop -d
View Detailed Process Info (v key)
The v key enables a detailed breakdown of each process, showing values such as UID, PID, GID, and CPU usage percentages, which is particularly handy when you need to track down specific users or services by their numeric identifiers or check which group owns certain resource-intensive processes.
atop -v
Show Process Commands (c key)
When you need to see exactly what command was run for each process, press the c key, which replaces the process name with the full command line, helping you pinpoint which script, binary, or flag was used, which is helpful for distinguishing between multiple instances of the same application or for debugging user-submitted jobs.
atop -c
Group Processes by Program (p key)
To get a high-level summary of program-level activity, use the p key, which aggregates data per executable program, showing how many times each was spawned and how much resource usage was accumulated. The left-most column shows the spawn count, while the right-most column lists the actual program names.
atop -p
Group Processes by User (u key)
When you’re interested in user-level resource usage, hit the u key, which shows how many processes each user currently runs or has run during the monitoring interval, as well as their cumulative CPU and memory usage.
atop -u
Monitor Network Usage (n key)
To enable per-process network traffic stats, you’ll need to install and activate the Netatop kernel module, which enhances atop’s ability to display sent and received traffic per process.
# RedHat-based:
sudo yum install kernel-devel zlib-devel

# Debian-based:
sudo apt-get install zlib1g-dev
Download and build:
wget http://www.atoptool.nl/download/netatop-0.3.tar.gz
tar -xvf netatop-0.3.tar.gz
cd netatop-0.3
make
sudo make install
To load the module and start the daemon automatically after boot:
sudo systemctl start netatop
sudo systemctl enable netatop
Once installed, pressing n inside atop will show you bytes sent/received, packet counts, and network-related errors for each process.
atop -n
Accessing Historical Logs
Atop stores binary log files at:
/var/log/atop/atop_YYYYMMDD
For example, a file like atop_20250630 contains logs for June 30, 2025, which are binary files and are not human-readable – only atop can parse them.
To view a specific time window from today’s log, say starting at 5:05 AM:
atop -r -b 05:05 -l 1
Here:
-rtells Atop to read from a log file.-bspecifies the beginning time.-l 1limits output to just one interval snapshot.
Use the spacebar to move forward through intervals and T to go back. Z jumps to the latest entry.
Get Help Inside Atop
While in the atop interface, press ? to view a full list of commands and shortcuts, which is useful when you want to discover less obvious options or tailor the display to your preferences.
Conclusion
I hope you find my article useful and helps you narrow down or prevent issues with your Linux system. In case you have any questions or would like to receive clarification for the usage of atop, please post a comment in the comment section below.


On Ubuntu 18.04 the following changes/additions where necessary:
“Config” file is now in /usr/share/atop/atop.daily.
@Kelems,
Thanks for sharing with us, hope it will help Ubuntu 18.04 users..
Hey how to pass number of samples to atop
make
./mkversion
cd module; make
make[1]: Entering directory `/root/netatop-0.3/module’
echo start the make
start the make
make -C /lib/modules/2.6.32-042stab120.11/build M=/root/netatop-0.3/module modules
make: Entering an unknown directory
make: *** /lib/modules/2.6.32-042stab120.11/build: No such file or directory. Stop.
make: Leaving an unknown directory
make[1]: *** [netatop.ko] Error 2
make[1]: Leaving directory `/root/netatop-0.3/module’
make: *** [all] Error 2
@Bruno,
Why you compiling from source atop? when you can easily install from default repositories using your system package manager APT or YUM.
Concerning: /lib/modules/2.6.32-042stab120.11/build: No such file or directory
I just got the same error on Centos 7. Apparently “uname -r” output mismatches the name of the kernel files the netatop needs (some minor version number differences).
Here’s the solution:
No per process network counter available, is coming when i run atopsar -N after installing netatop following your steps above.
Hi, atop is really a good software to monitor system processes. first when i install this. I got error again after trying two times i got the same error. Then i discussed with my mentor about this. he resolved the issue.Thanks for sharing this blog post.
hi … i’m a linux newbie and am using SLES 11. How would i go about getting atop installed on SLES … it doesn’t appear to be mentioned above
@Jamie,
Yeah, you can install atop on Suse Linux with the help of following commands.
Hi everyone,
I would like to see log in a period time: atop -r -b 15:45 -e 16:20
But i only see a log right after the beginning time (15:45). How i can see the next log.
Thank you so much.
Hello maqsimum,
If you have used the epel repository to install the package, the configuration can be found in:
/etc/sysconfgi/atop
You can use this command:
sed ‘s/600/60/’ /etc/sysconfig/atop -i
When I run the command to modify atop from 600 seconds to 60, it gives an error:
# sed ‘s/600/60/’ /etc/atop/atop.daily -i
sed: can’t read /etc/atop/atop.daily: No such file or directory