In our last article, we have learned about installing and upgrading the sysstat package and understanding briefly about the utilities which comes with the package.
Today, we are going to work with some interesting practical examples of mpstat, pidstat, iostat and sar utilities, which can help us to identify the issues. We have different options to use these utilities, I mean you can fire the commands manually with different options for different kind of work or you can create your customized scripts according to your requirements. You know Sysadmins are always bit Lazy, and always tried to find out the easy way to do the things with minimum efforts.
mpstat – Processors Statistics
1. Using mpstat command without any option, will display the Global Average Activities by All CPUs.
tecmint@tecmint ~ $ mpstat

Linux 3.11.0-23-generic (tecmint.com) 	Thursday 04 September 2014 	_i686_	(2 CPU)

12:23:57  IST  CPU    %usr   %nice    %sys %iowait    %irq   %soft  %steal  %guest  %gnice   %idle
12:23:57  IST  all   37.35    0.01    4.72    2.96    0.00    0.07    0.00    0.00    0.00   54.88
2. Using mpstat with option ‘-P‘ (Indicate Processor Number) and ‘ALL’, will display statistics about all CPUs one by one starting from 0. 0 will the first one.
tecmint@tecmint ~ $ mpstat -P ALL

Linux 3.11.0-23-generic (tecmint.com) 	Thursday 04 September 2014 	_i686_	(2 CPU)

12:29:26  IST  CPU    %usr   %nice    %sys %iowait    %irq   %soft  %steal  %guest  %gnice   %idle
12:29:26  IST  all   37.33    0.01    4.57    2.58    0.00    0.07    0.00    0.00    0.00   55.44
12:29:26  IST    0   37.90    0.01    4.96    2.62    0.00    0.03    0.00    0.00    0.00   54.48
12:29:26  IST    1   36.75    0.01    4.19    2.54    0.00    0.11    0.00    0.00    0.00   56.40
3. To display the statistics for N number of iterations after n seconds interval with average of each cpu use the following command.
tecmint@tecmint ~ $ mpstat -P ALL 2 5

Linux 3.11.0-23-generic (tecmint.com) 	Thursday 04 September 2014 	_i686_	(2 CPU)

12:36:21  IST  CPU    %usr   %nice    %sys %iowait    %irq   %soft  %steal  %guest  %gnice   %idle
12:36:23  IST  all   53.38    0.00    2.26    0.00    0.00    0.00    0.00    0.00    0.00   44.36
12:36:23  IST    0   46.23    0.00    1.51    0.00    0.00    0.00    0.00    0.00    0.00   52.26
12:36:23  IST    1   60.80    0.00    3.02    0.00    0.00    0.00    0.00    0.00    0.00   36.18

12:36:23  IST  CPU    %usr   %nice    %sys %iowait    %irq   %soft  %steal  %guest  %gnice   %idle
12:36:25  IST  all   34.18    0.00    2.30    0.00    0.00    0.00    0.00    0.00    0.00   63.52
12:36:25  IST    0   31.63    0.00    1.53    0.00    0.00    0.00    0.00    0.00    0.00   66.84
12:36:25  IST    1   36.73    0.00    2.55    0.00    0.00    0.00    0.00    0.00    0.00   60.71

12:36:25  IST  CPU    %usr   %nice    %sys %iowait    %irq   %soft  %steal  %guest  %gnice   %idle
12:36:27  IST  all   33.42    0.00    5.06    0.25    0.00    0.25    0.00    0.00    0.00   61.01
12:36:27  IST    0   34.34    0.00    4.04    0.00    0.00    0.00    0.00    0.00    0.00   61.62
12:36:27  IST    1   32.82    0.00    6.15    0.51    0.00    0.00    0.00    0.00    0.00   60.51
4. The option ‘I‘ will print total number of interrupt statistics about per processor.
tecmint@tecmint ~ $ mpstat -I

Linux 3.11.0-23-generic (tecmint.com) 	Thursday 04 September 2014 	_i686_	(2 CPU)

12:39:56  IST  CPU    intr/s
12:39:56  IST  all    651.04

12:39:56  IST  CPU        0/s        1/s        6/s        8/s        9/s       12/s       16/s       17/s       20/s       21/s       22/s       23/s       45/s       46/s       47/s      NMI/s      LOC/s      SPU/s      PMI/s      IWI/s      RTR/s      RES/s      CAL/s      TLB/s      TRM/s      THR/s      MCE/s      MCP/s      ERR/s      MIS/s
12:39:56  IST    0      76.27       1.73       0.00       0.00       0.42       0.33       0.00       0.06      11.46       0.00       0.00       0.01       7.62       1.87       0.05       0.33     182.26       0.00       0.33       3.03       0.00      22.66       0.16       5.14       0.00       0.00       0.00       0.00       0.00       0.00
12:39:56  IST    1      70.88       1.44       0.00       0.00       0.41       0.33       0.00      27.91      10.33       0.00       0.00       0.01       7.27       1.79       0.05       0.32     184.11       0.00       0.32       5.17       0.00      22.09       0.13       4.73       0.00       0.00       0.00       0.00       0.00       0.00

12:39:56  IST  CPU       HI/s    TIMER/s   NET_TX/s   NET_RX/s    BLOCK/s BLOCK_IOPOLL/s  TASKLET/s    SCHED/s  HRTIMER/s      RCU/s
12:39:56  IST    0       0.00     116.49       0.05       0.27       7.33       0.00       1.22      10.44       0.13      37.47
12:39:56  IST    1       0.00     111.65       0.05       0.41       7.07       0.00      56.36       9.97       0.13      41.38
5. Get all the above information in one command i.e. equivalent to “-u -I ALL -p ALL“.
tecmint@tecmint ~ $ mpstat -A

Linux 3.11.0-23-generic (tecmint.com) 	Thursday 04 September 2014 	_i686_	(2 CPU)

12:41:39  IST  CPU    %usr   %nice    %sys %iowait    %irq   %soft  %steal  %guest  %gnice   %idle
12:41:39  IST  all   38.70    0.01    4.47    2.01    0.00    0.06    0.00    0.00    0.00   54.76
12:41:39  IST    0   39.15    0.01    4.82    2.05    0.00    0.02    0.00    0.00    0.00   53.95
12:41:39  IST    1   38.24    0.01    4.12    1.98    0.00    0.09    0.00    0.00    0.00   55.57

12:41:39  IST  CPU    intr/s
12:41:39  IST  all    651.73
12:41:39  IST    0    173.16
12:41:39  IST    1    225.89

12:41:39  IST  CPU        0/s        1/s        6/s        8/s        9/s       12/s       16/s       17/s       20/s       21/s       22/s       23/s       45/s       46/s       47/s      NMI/s      LOC/s      SPU/s      PMI/s      IWI/s      RTR/s      RES/s      CAL/s      TLB/s      TRM/s      THR/s      MCE/s      MCP/s      ERR/s      MIS/s
12:41:39  IST    0      76.04       1.77       0.00       0.00       0.41       0.36       0.00       0.06      11.60       0.00       0.00       0.01       7.42       1.83       0.05       0.34     182.89       0.00       0.34       2.97       0.00      22.69       0.16       5.22       0.00       0.00       0.00       0.00       0.00       0.00
12:41:39  IST    1      70.70       1.48       0.00       0.00       0.40       0.36       0.00      27.47      10.46       0.00       0.00       0.01       7.08       1.75       0.05       0.32     184.83       0.00       0.32       5.10       0.00      22.19       0.13       4.91       0.00       0.00       0.00       0.00       0.00       0.00

12:41:39  IST  CPU       HI/s    TIMER/s   NET_TX/s   NET_RX/s    BLOCK/s BLOCK_IOPOLL/s  TASKLET/s    SCHED/s  HRTIMER/s      RCU/s
12:41:39  IST    0       0.00     116.96       0.05       0.26       7.12       0.00       1.24      10.42       0.12      36.99
12:41:39  IST    1       0.00     112.25       0.05       0.40       6.88       0.00      55.05       9.93       0.13      41.20
pidstat – Process and Kernel Threads Statistics
This is used for process monitoring and current threads, which are being managed by kernel. pidstat can also check the status about child processes and threads.
Syntax
# pidstat <OPTIONS> [INTERVAL] [COUNT]
6. Using pidstat command without any argument, will display all active tasks.
tecmint@tecmint ~ $ pidstat

Linux 3.11.0-23-generic (tecmint.com) 	Thursday 04 September 2014 	_i686_	(2 CPU)

12:47:24  IST   UID       PID    %usr %system  %guest    %CPU   CPU  Command
12:47:24  IST     0         1    0.01    0.12    0.00    0.13     1  init
12:47:24  IST     0         3    0.00    0.01    0.00    0.01     0  ksoftirqd/0
12:47:24  IST     0         9    0.00    0.04    0.00    0.04     0  rcu_sched
12:47:24  IST     0        10    0.00    0.00    0.00    0.00     0  watchdog/0
12:47:24  IST     0        11    0.00    0.00    0.00    0.00     1  watchdog/1
12:47:24  IST     0        12    0.00    0.00    0.00    0.00     1  migration/1
12:47:24  IST     0        13    0.00    0.01    0.00    0.01     1  ksoftirqd/1
12:47:24  IST     0        23    0.00    0.00    0.00    0.00     0  kworker/u9:0
12:47:24  IST     0        29    0.00    0.61    0.00    0.61     0  kworker/0:1
12:47:24  IST     0        30    0.00    0.06    0.00    0.06     1  kworker/1:1
12:47:24  IST     0       224    0.00    0.01    0.00    0.01     1  jbd2/sda1-8
12:47:24  IST     0       360    0.00    0.00    0.00    0.00     1  upstart-udev-br
12:47:24  IST     0       365    0.01    0.00    0.00    0.01     0  systemd-udevd
12:47:24  IST     0       476    0.00    0.00    0.00    0.00     0  kworker/u9:1
7. To print all active and non-active tasks use the option ‘-p‘ (processes).
tecmint@tecmint ~ $ pidstat -p ALL

Linux 3.11.0-23-generic (tecmint.com) 	Thursday 04 September 2014 	_i686_	(2 CPU)

12:51:55  IST   UID       PID    %usr %system  %guest    %CPU   CPU  Command
12:51:55  IST     0         1    0.01    0.11    0.00    0.12     1  init
12:51:55  IST     0         2    0.00    0.00    0.00    0.00     0  kthreadd
12:51:55  IST     0         3    0.00    0.01    0.00    0.01     0  ksoftirqd/0
12:51:55  IST     0         5    0.00    0.00    0.00    0.00     0  kworker/0:0H
12:51:55  IST     0         7    0.00    0.00    0.00    0.00     0  migration/0
12:51:55  IST     0         8    0.00    0.00    0.00    0.00     0  rcu_bh
12:51:55  IST     0         9    0.00    0.04    0.00    0.04     1  rcu_sched
12:51:55  IST     0        10    0.00    0.00    0.00    0.00     0  watchdog/0
12:51:55  IST     0        11    0.00    0.00    0.00    0.00     1  watchdog/1
12:51:55  IST     0        12    0.00    0.00    0.00    0.00     1  migration/1
12:51:55  IST     0        13    0.00    0.01    0.00    0.01     1  ksoftirqd/1
12:51:55  IST     0        15    0.00    0.00    0.00    0.00     1  kworker/1:0H
12:51:55  IST     0        16    0.00    0.00    0.00    0.00     1  khelper
12:51:55  IST     0        17    0.00    0.00    0.00    0.00     0  kdevtmpfs
12:51:55  IST     0        18    0.00    0.00    0.00    0.00     0  netns
12:51:55  IST     0        19    0.00    0.00    0.00    0.00     0  writeback
12:51:55  IST     0        20    0.00    0.00    0.00    0.00     1  kintegrityd
8. Using pidstat command with ‘-d 2‘ option, we can get I/O statistics and 2 is interval in seconds to get refreshed statistics. This option can be handy in situation, where your system is undergoing heavy I/O and you want to get clues about the processes consuming high resources.
tecmint@tecmint ~ $ pidstat -d 2

Linux 3.11.0-23-generic (tecmint.com) 	Thursday 04 September 2014 	_i686_	(2 CPU)

03:26:53  EDT       PID   kB_rd/s   kB_wr/s kB_ccwr/s  Command

03:26:55  EDT       PID   kB_rd/s   kB_wr/s kB_ccwr/s  Command
03:26:57  EDT       574      0.00    148.00      2.00  miniserv.pl

03:27:01  EDT       PID   kB_rd/s   kB_wr/s kB_ccwr/s  Command
03:27:03  EDT         1      0.00      8.00      2.00  init
03:27:03  EDT       450      0.00      2.00      0.00  rsyslogd
03:27:03  EDT       534    138.00     10.00      4.00  crond
03:27:03  EDT     25100      0.00      6.00      0.00  sendmail
03:27:03  EDT     30829      0.00      6.00      0.00  java
9. To know the cpu statistics along with all threads about the process id 4164 at interval of 2 sec for 3 times use the following command with option ‘-t‘ (display statistics of selected process).
tecmint@tecmint ~ $ pidstat -t -p 4164 2 3

Linux 3.11.0-23-generic (tecmint.com) 	Thursday 04 September 2014 	_i686_	(2 CPU)

01:09:06  IST   UID      TGID       TID    %usr %system  %guest    %CPU   CPU  Command
01:09:08  IST  1000      4164         -   22.00    1.00    0.00   23.00     1  firefox
01:09:08  IST  1000         -      4164   20.00    0.50    0.00   20.50     1  |__firefox
01:09:08  IST  1000         -      4171    0.00    0.00    0.00    0.00     0  |__Gecko_IOThread
01:09:08  IST  1000         -      4172    0.00    0.00    0.00    0.00     0  |__Socket
01:09:08  IST  1000         -      4173    0.00    0.00    0.00    0.00     0  |__JS
01:09:08  IST  1000         -      4174    0.00    0.00    0.00    0.00     0  |__JS
01:09:08  IST  1000         -      4175    0.00    0.00    0.00    0.00     0  |__Hang
01:09:08  IST  1000         -      4176    0.00    0.00    0.00    0.00     1  |__gdbus
01:09:08  IST  1000         -      4177    0.00    0.00    0.00    0.00     1  |__gmain
10. Use the ‘-rh‘ option, to know the about memory utilization of processes which are frequently varying their utilization in 2 second interval.
tecmint@tecmint ~ $ pidstat -rh 2 3

Linux 3.11.0-23-generic (tecmint.com) 	Thursday 04 September 2014 	_i686_	(2 CPU)

#      Time   UID       PID  minflt/s  majflt/s     VSZ    RSS   %MEM  Command
 1409816695  1000      3958   3378.22      0.00  707420 215972   5.32  cinnamon
 1409816695  1000      4164    406.93      0.00 1252024 461404  11.36  firefox
 1409816695  1000      6676    168.81      0.00    4436    984   0.02  pidstat

#      Time   UID       PID  minflt/s  majflt/s     VSZ    RSS   %MEM  Command
 1409816697     0      1601    644.00      0.00  506728 316788   7.80  Xorg
 1409816697  1000      3958   3412.00      0.00  707420 215972   5.32  cinnamon
 1409816697  1000      4164   2667.00      0.00 1259576 471724  11.62  firefox
 1409816697  1000      6676    172.50      0.00    4436   1020   0.03  pidstat

#      Time   UID       PID  minflt/s  majflt/s     VSZ    RSS   %MEM  Command
 1409816699     0      1601    644.00      0.00  506728 316788   7.80  Xorg
 1409816699  1000      3958   4094.00      0.00  710148 218700   5.39  cinnamon
 1409816699  1000      4164    599.00      0.00 1261944 476664  11.74  firefox
 1409816699  1000      6676    168.00      0.00    4436   1020   0.03  pidstat
11. To print all the process of containing string “VB“, use ‘-t‘ option to see threads as well.
tecmint@tecmint ~ $ pidstat -G VB

Linux 3.11.0-23-generic (tecmint.com) 	Thursday 04 September 2014 	_i686_	(2 CPU)

01:09:06  IST   UID      PID      %usr 	%system  %guest    %CPU   CPU  	Command
01:09:08  IST  1000    1492     22.00     1.00    	 0.00   	 23.00     1  		VBoxService
01:09:08  IST  1000    1902     4164      20.00    	 0.50    	 0.00   	20.50     	VBoxClient
01:09:08  IST  1000    1922     4171      0.00    	 0.00    	 0.00    	0.00     	VBoxClient
tecmint@tecmint ~ $ pidstat  -t -G VB
Linux 2.6.32-431.el6.i686 (tecmint) 09/04/2014 _i686_	(2 CPU)

03:19:52 PM   UID      TGID       TID    %usr %system  %guest    %CPU   CPU  Command
03:19:52 PM     0      1479         -    0.01    0.12    0.00    0.13     1  VBoxService
03:19:52 PM     0         -      1482    0.00    0.00    0.00    0.00     0  |__timesync
03:19:52 PM     0         -      1483    0.01    0.06    0.00    0.06     0  |__vminfo
03:19:52 PM     0         -      1485    0.00    0.01    0.00    0.01     1  |__memballoon
03:19:52 PM     0         -      1486    0.00    0.01    0.00    0.01     1  |__vmstats
03:19:52 PM     0         -      1487    0.00    0.05    0.00    0.05     0  |__automount
03:19:52 PM     0      1913         -    0.00    0.00    0.00    0.00     0  VBoxClient
03:19:52 PM     0         -      1913    0.00    0.00    0.00    0.00     0  |__VBoxClient
03:19:52 PM     0         -      1942    0.00    0.00    0.00    0.00     0  |__SHCLIP
03:19:52 PM     0      1933         -    0.04    0.89    0.00    0.93     0  VBoxClient
03:19:52 PM     0         -      1936    0.04    0.89    0.00    0.93     1  |__X11-NOTIFY
12. To get realtime priority and scheduling information use option ‘-R‘ .
tecmint@tecmint ~ $ pidstat -R

Linux 3.11.0-23-generic (tecmint.com) 	Thursday 04 September 2014 	_i686_	(2 CPU)

01:09:06  IST   UID      PID	 prio      policy 	Command
01:09:08  IST  1000    3     	 99	       FIFO		migration/0
01:09:08  IST  1000    5     	 99          FIFO	migration/0
01:09:08  IST  1000    6    	 99          FIFO	watchdog/0
Here, I am not going to cover about Iostat utility, as we are already covered it. Please have a look on “Linux Performance Monitoring with Vmstat and Iostat” to get all details about iostat.
sar – System Activity Reporter
Using “sar” command, we can get the reports about whole system’s performance. This can help us to locate the system bottleneck and provide the help to find out the solutions to these annoying performance issues.
The Linux Kernel maintains some counter internally, which keeps track of all requests, their completion time and I/O block counts etc. From all these information, sar calculates rates and ratio of these request to find out about bottleneck areas.
The main thing about the sar is that, it reports all activities over a period if time. So, make sure that sar collect data on appropriate time (not on Lunch time or on weekend.:)
13. Following is a basic command to invoke sar. It will create one file named “sarfile” in your current directory. The options ‘-u‘ is for CPU details and will collect 5 reports at an interval of 2 seconds.
tecmint@tecmint ~ $ sar -u -o sarfile 2 5

Linux 3.11.0-23-generic (tecmint.com) 	Thursday 04 September 2014 	_i686_	(2 CPU)

01:42:28  IST     CPU     %user     %nice   %system   %iowait    %steal     %idle
01:42:30  IST     all     36.52      0.00      3.02      0.00      0.00     60.45
01:42:32  IST     all     43.32      0.00      5.04      0.00      0.00     51.64
01:42:34  IST     all     56.46      0.00      4.05      0.00      0.00     39.49
01:42:36  IST     all     44.44      0.00      3.79      0.00      0.00     51.77
01:42:38  IST     all     50.75      0.00      3.75      0.00      0.00     45.50
Average:        all     46.30      0.00      3.93      0.00      0.00     49.77
14. In the above example, we have invoked sar interactively. We also have an option to invoke it non-interactively via cron using scripts /usr/local/lib/sa1 and /usr/local/lib/sa2 (If you have used /usr/local as prefix during installation time).
- /usr/local/lib/sa1 is a shell script that we can use for scheduling cron which will create daily binary log file.
- /usr/local/lib/sa2 is a shell script will change binary log file to human-readable form.
Use the following Cron entries for making this non-interactive:
# Run sa1 shell script every 10 minutes for collecting data
*/2 * * * * /usr/local/lib/sa/sa1 2 10

# Generate a daily report in human readable format at 23:53
53 23 * * * /usr/local/lib/sa/sa2 -A
At the back-end sa1 script will call sadc (System Activity Data Collector) utility for fetching the data at a particular interval. sa2 will call sar for changing binary log file to human readable form.
15. Check run queue length, total number of processes and load average using ‘-q‘ option.
tecmint@tecmint ~ $ sar -q 2 5

Linux 3.11.0-23-generic (tecmint.com) 	Thursday 04 September 2014 	_i686_	(2 CPU)

02:00:44  IST   runq-sz  plist-sz   ldavg-1   ldavg-5  ldavg-15   blocked
02:00:46  IST         1       431      1.67      1.22      0.97         0
02:00:48  IST         4       431      1.70      1.23      0.97         0
02:00:50  IST         2       431      1.70      1.23      0.97         0
02:00:52  IST         2       431      1.70      1.23      0.97         0
02:00:54  IST         0       431      1.64      1.23      0.97         0
Average:            2       431      1.68      1.23      0.97         0
16. Check statistics about the mounted file systems using ‘-F‘.
tecmint@tecmint ~ $ sar -F 2 4

Linux 3.11.0-23-generic (tecmint.com) 	Thursday 04 September 2014 	_i686_	(2 CPU)

02:02:31  IST  MBfsfree  MBfsused   %fsused  %ufsused     Ifree     Iused    %Iused FILESYSTEM
02:02:33  IST      1001       449     30.95    1213790475088.85  18919505    364463      1.89 /dev/sda1

02:02:33  IST  MBfsfree  MBfsused   %fsused  %ufsused     Ifree     Iused    %Iused FILESYSTEM
02:02:35  IST      1001       449     30.95    1213790475088.85  18919505    364463      1.89 /dev/sda1

02:02:35  IST  MBfsfree  MBfsused   %fsused  %ufsused     Ifree     Iused    %Iused FILESYSTEM
02:02:37  IST      1001       449     30.95    1213790475088.85  18919505    364463      1.89 /dev/sda1

02:02:37  IST  MBfsfree  MBfsused   %fsused  %ufsused     Ifree     Iused    %Iused FILESYSTEM
02:02:39  IST      1001       449     30.95    1213790475088.86  18919505    364463      1.89 /dev/sda1

Summary      MBfsfree  MBfsused   %fsused  %ufsused     Ifree     Iused    %Iused FILESYSTEM
Summary          1001       449     30.95    1213790475088.86  18919505    364463      1.89 /dev/sda1
17. View network statistics using ‘-n DEV‘.
tecmint@tecmint ~ $ sar -n DEV 1 3 | egrep -v lo

Linux 3.11.0-23-generic (tecmint.com) 	Thursday 04 September 2014 	_i686_	(2 CPU)

02:11:59  IST     IFACE   rxpck/s   txpck/s    rxkB/s    txkB/s   rxcmp/s   txcmp/s  rxmcst/s
02:12:00  IST     wlan0      8.00     10.00      1.23      0.92      0.00      0.00      0.00
02:12:00  IST    vmnet8      0.00      0.00      0.00      0.00      0.00      0.00      0.00
02:12:00  IST      eth0      0.00      0.00      0.00      0.00      0.00      0.00      0.00
02:12:00  IST    vmnet1      0.00      0.00      0.00      0.00      0.00      0.00      0.00
18. View block device statistics like iostat using ‘-d‘.
tecmint@tecmint ~ $ sar -d 1 3

Linux 3.11.0-23-generic (tecmint.com) 	Thursday 04 September 2014 	_i686_	(2 CPU)

02:13:17  IST       DEV       tps  rd_sec/s  wr_sec/s  avgrq-sz  avgqu-sz     await     svctm     %util
02:13:18  IST    dev8-0      0.00      0.00      0.00      0.00      0.00      0.00      0.00      0.00

02:13:18  IST       DEV       tps  rd_sec/s  wr_sec/s  avgrq-sz  avgqu-sz     await     svctm     %util
02:13:19  IST    dev8-0      0.00      0.00      0.00      0.00      0.00      0.00      0.00      0.00

02:13:19  IST       DEV       tps  rd_sec/s  wr_sec/s  avgrq-sz  avgqu-sz     await     svctm     %util
02:13:20  IST    dev8-0      7.00     32.00     80.00     16.00      0.11     15.43     15.43     10.80
19. To print memory statistics use ‘-r‘ option.
tecmint@tecmint ~ $ sar -r 1 3

Linux 3.11.0-23-generic (tecmint.com) 	Thursday 04 September 2014 	_i686_	(2 CPU)

02:14:29  IST kbmemfree kbmemused  %memused kbbuffers  kbcached  kbcommit   %commit  kbactive   kbinact   kbdirty
02:14:30  IST   1465660   2594840     63.90    133052   1549644   3710800     45.35   1133148   1359792       392
02:14:31  IST   1472724   2587776     63.73    133060   1549792   3715504     45.40   1125816   1360000       836
02:14:32  IST   1469112   2591388     63.82    133060   1550036   3705288     45.28   1130252   1360168       804
Average:      1469165   2591335     63.82    133057   1549824   3710531     45.34   1129739   1359987       677
20. Using ‘safd -d‘, we can extract data in format which can be processed using databases.
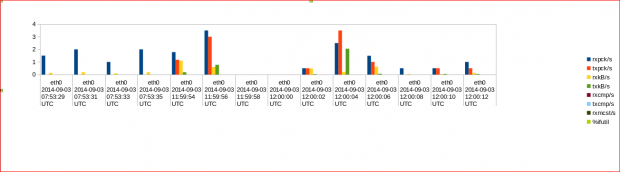
tecmint@tecmint ~ $ safd -d /var/log/sa/sa20140903 -- -n DEV | grep -v lo

 # hostname;interval;timestamp;IFACE;rxpck/s;txpck/s;rxkB/s;txkB/s;rxcmp/s;txcmp/s;rxmcst/s;%ifutil
tecmint;2;2014-09-03 07:53:29 UTC;eth0;1.50;0.00;0.13;0.00;0.00;0.00;0.00;0.00
tecmint;2;2014-09-03 07:53:31 UTC;eth0;2.00;0.00;0.18;0.00;0.00;0.00;0.00;0.00
tecmint;2;2014-09-03 07:53:33 UTC;eth0;1.00;0.00;0.09;0.00;0.00;0.00;0.00;0.00
tecmint;2;2014-09-03 07:53:35 UTC;eth0;2.00;0.00;0.18;0.00;0.00;0.00;0.00;0.00
tecmint;14778;2014-09-03 11:59:54 UTC;eth0;1.78;1.17;1.10;0.18;0.00;0.00;0.00;0.00
tecmint;2;2014-09-03 11:59:56 UTC;eth0;3.50;3.00;0.60;0.77;0.00;0.00;0.00;0.00
tecmint;2;2014-09-03 11:59:58 UTC;eth0;0.00;0.00;0.00;0.00;0.00;0.00;0.00;0.00
tecmint;2;2014-09-03 12:00:00 UTC;eth0;0.00;0.00;0.00;0.00;0.00;0.00;0.00;0.00
tecmint;2;2014-09-03 12:00:02 UTC;eth0;0.50;0.50;0.48;0.03;0.00;0.00;0.00;0.00
tecmint;2;2014-09-03 12:00:04 UTC;eth0;2.50;3.50;0.21;2.05;0.00;0.00;0.00;0.00
tecmint;2;2014-09-03 12:00:06 UTC;eth0;1.49;1.00;0.62;0.06;0.00;0.00;0.00;0.00
tecmint;2;2014-09-03 12:00:08 UTC;eth0;0.50;0.00;0.03;0.00;0.00;0.00;0.00;0.00
tecmint;2;2014-09-03 12:00:10 UTC;eth0;0.50;0.50;0.03;0.04;0.00;0.00;0.00;0.00
tecmint;2;2014-09-03 12:00:12 UTC;eth0;1.00;0.50;0.12;0.04;0.00;0.00;0.00;0.00
You can also save this to a csv and then can draw chart for presentation kind of stuff as below.
That’s it for now, you can refer man pages for more information about each option and don’t forget to tell about article with your valuable comments.


Great tutorial. You could also analyze sar report to get charts and aggregated data. For that we can follow https://github.com/sumitbiswasgit/sarbox
I hesitate to comment on an old post but I did notice that on 20. Using ‘sadf’ the example for some reasons shows the cmd as ‘safd’ so initially I thought I didn’t have the package available. Otherwise very useful post.
@Mark,
Thanks for informing about that error, yes it was actually “safd” command. Corrected in the article.
Hi Kuldeep,
Thanks for the good info on SAR..,Not sure if this is a right platform to talk about problem with Sar version 8.1.5.
One of the issues with sar is that the “sar -A” command gives the datestamp exactly past one month in the first line of the output..
Any suggestion/help would be much appreciated..
Thanks,
-Sayyad
Hi Sayyad,
8.1.5 seems quit old and at same time it was not stable release.
I would suggest to update the same and check results.
More Detail: http://sebastien.godard.pagesperso-orange.fr/download.html
Thanks// Kuldeep
Thank you :) !!
You have to change “HISTORY” parameter to 30 days.
File need to modify:
/etc/sysconfig/sysstat
Paramter:
HISTORY=30
Thanks!!
Hi Kuldeep,
Good Article.
I want sar to keep the record of last 30 days, how to do that?