The most important duty of a Linux system administrator is to make sure the system he/she is administering is in very good condition. There are many tools available for Linux system admins that can help to monitor and display processes in a system such as top and htop, but none of these tools can compete with collectl.
collectl is a very nice feature-rich command-line utility that can be used to collect performance data that describes the current system status. Unlike most of the other monitoring tools, collectl does not focus on a limited number of system metrics, instead, it can gather information on many different types of system resources such as cpu, disk, memory, network, sockets, tcp, inodes, infiniband, cluster, memory, nfs, processes, quadrics, slabs, and buddyinfo.
A very good thing about using collectl is that it can also play the role of utilities that are designed with only a specific purpose such as top, ps, iotop, and many others. What are some features that make colleclt a useful tool?
Following are some of the most important features of the collectl command-line utility for you guys.
Collectl Features
- It can run interactively, as a daemon, or both.
- It can display the output in many formats.
- It has the ability to monitor almost any subsystem.
- It can play the role of many other utilities such as ps, top, iotop, and vmstat.
- It has the ability to record and playback the captured data.
- It can export data in various file formats. (this is very useful when you want to analyze the data with external tools).
- It can run as a service to monitor remote machines or an entire server cluster.
- It can display the data in the terminal, and write to a file or a socket.
How to Install collectl in Linux
The collectl utility runs on all Linux distributions, the only thing it requires to run is perl, so make sure that you have Perl installed (comes pre-installed) in your machine before installing collectl in your machine.
Install Collectl in Debian Systems
The following command can be used to install the collectl utility in Debian-based distributions such as Ubuntu and Linux Mint.
$ sudo apt-get install collectl
Install Collectl in Debian Systems
If you are using RedHat-based distribution such as Rocky Linux or AlmaLinux, or any other Linux distribution, you can easily download the tarball, unpack it and run as shown
# wget https://sourceforge.net/projects/collectl/files/latest/download -O collectl.tar.gz
# tar -xvf collectl.tar.gz
# cd collectl-*
# ./INSTALL
Using Collectl Monitoring Tool in Linux
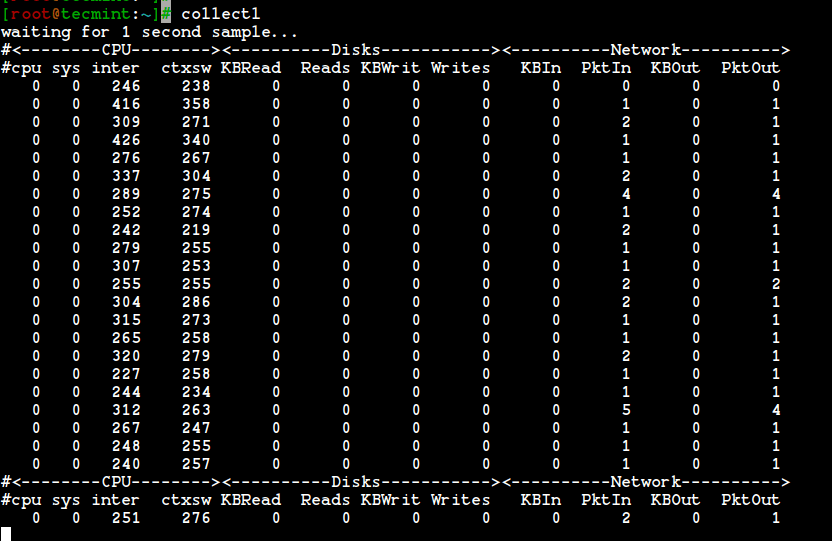
Once the installation of the collectl tool is finished, you can easily run it from the terminal, even without any option. The following command will display information on cpu, disk, and network stats in a very short and human-readable format.
# collectl
As you guys can see from the above output displayed on the terminal screen, it is very easy to work with the system metrics values present in the command output because it appears on a single line.
When the collectl utility is executed without any option it displays information about the following subsystems:
- cpu
- disks
- network
Note: In our case, a subsystem is every type of system resource that can be measured.
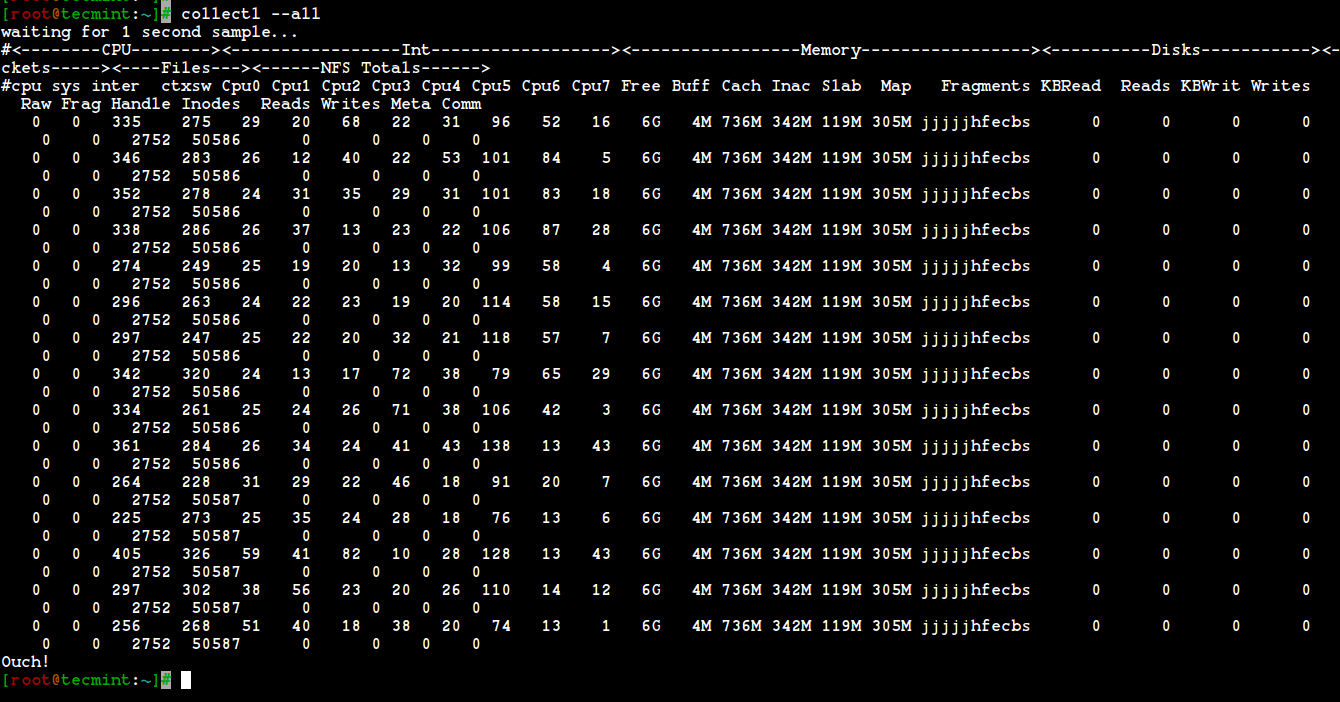
You can also display statistics for all subsystems except slabs by combining the command with the --all option as shown below.
# collectl --all
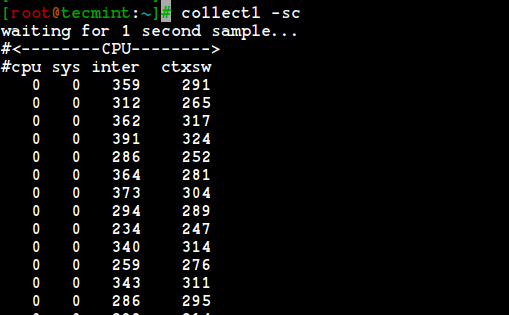
But, how do you monitor the cpu usage with the help of the utility? The -s option should be used to control which subsystem data is to be collected or played back.
For example, the following command can be used to monitor the summary of the cpu usage.
# collectl -sc
What happens when you combine the command with “scdn“? The best way to learn how to use command-line tools is to practice as much as possible, so run the following command in your terminal and see what is going to happen.
# collectl -scdn
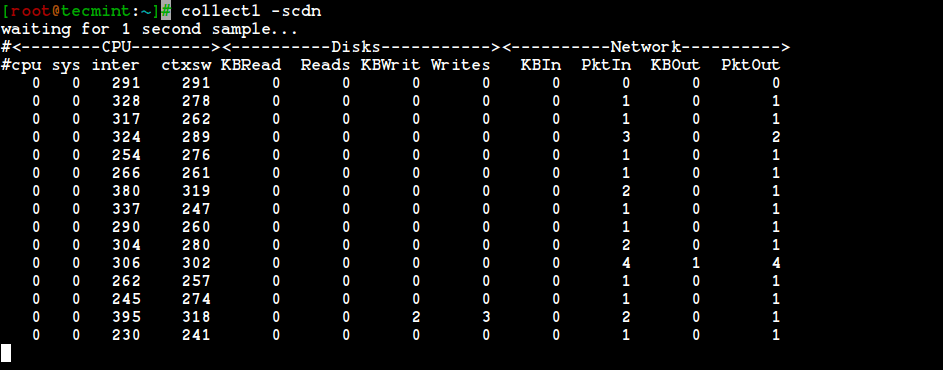
You can easily understand that the default option is “cdn“, it stands for cpu, disks, and network data. The result of the command is the same as the output of “collectl -scn”
If you want to collect data about the memory, use the following command.
# collectl -sm
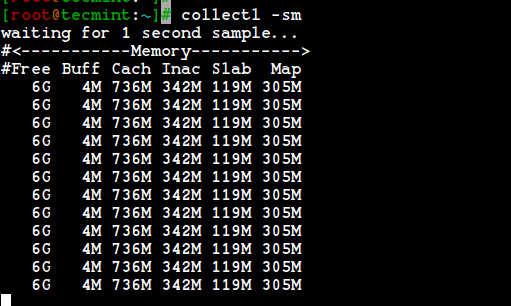
The above output is very useful when you want to get some detailed information on your memory usage, free memory, and other important stuff for the performance of your system.
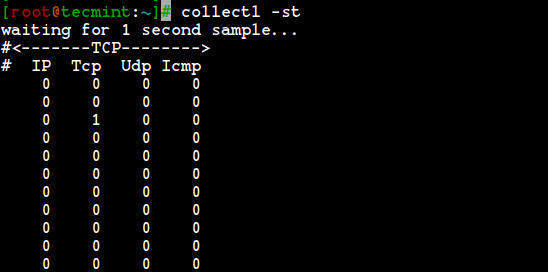
How about some data on tcp? Use the following command to do it.
# collectl -st
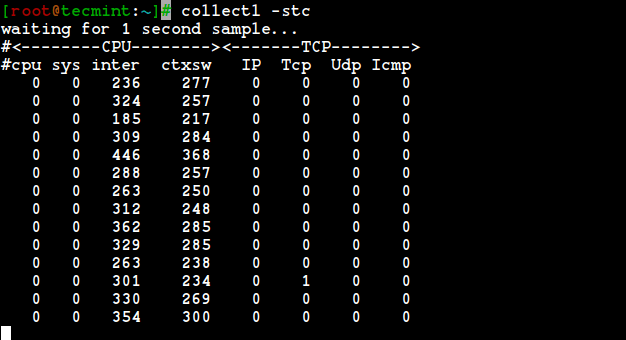
After you have gained some experience you can easily combine options to get the results you want. For example, you can combine the “t” for tcp and “c” for cpu. The following command does that.
# collectl -stc
It is hard for us humans to remember all the available options so I am posting the summary list of subsystems supported by the tool.
b– buddy info (memory fragmentation)c– CPUd– Diskf– NFS V3 Datai– Inode and File Systemj– Interruptsl– Lustrem– Memoryn– Networkss– Socketst– TCPx– Interconnecty– Slabs (system object caches)
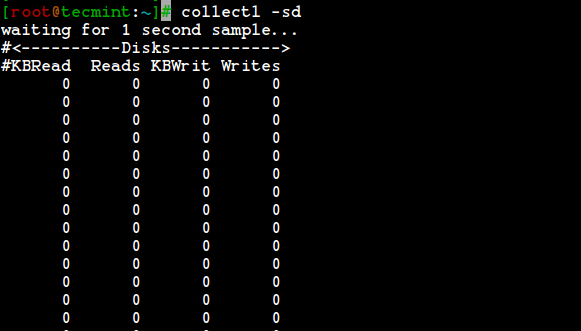
A very important piece of data for a system administrator or a Linux user is the data collected on disk usage. The following command will help you to monitor disk usage.
# collectl -sd
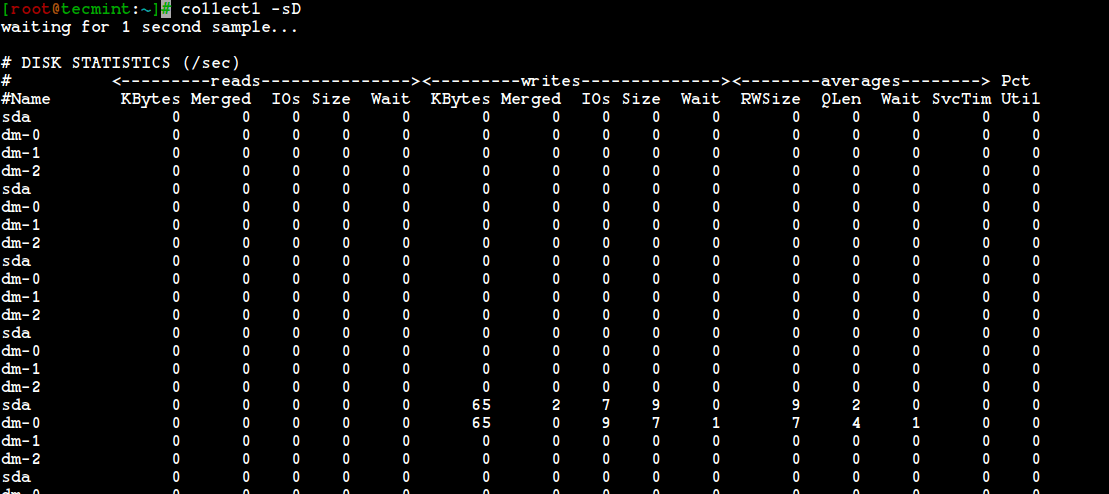
You can also use the “-sD” option to collect data on individual disks, but you have to know that information on total disks will not be reported.
# collectl -sD
You can also use other detail subsystems to collect detailed data. The following is a list of the detailed subsystems.
C– CPUD– DiskE– Environmental data (fan, power, temp), via ipmitoolF– NFS DataJ– InterruptsL– Lustre OST detail OR client Filesystem detailN– NetworksT– 65 TCP counters only available in plot formatX– InterconnectY– Slabs (system object caches)Z– Processes
There are many available options in the collectl utility, but there is not enough time and space to cover them all in only one article. However, it is worth mentioning and teaching how to use the utility as top and ps.
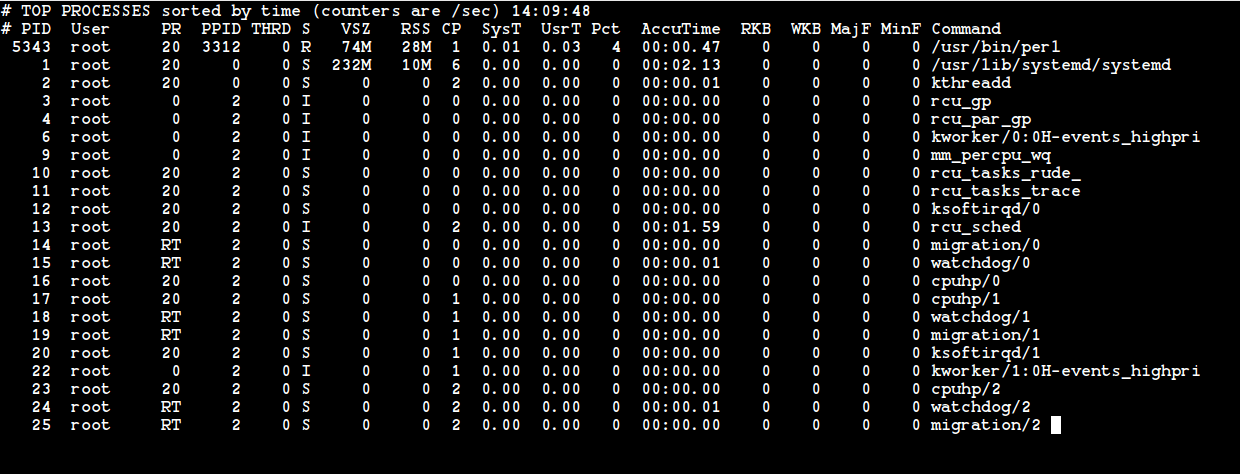
It is very easy to make collectl work as the top utility, just run the following command in your terminal and you will see a similar output in the top tool gives you when it is executed in your Linux system.
# collectl --top
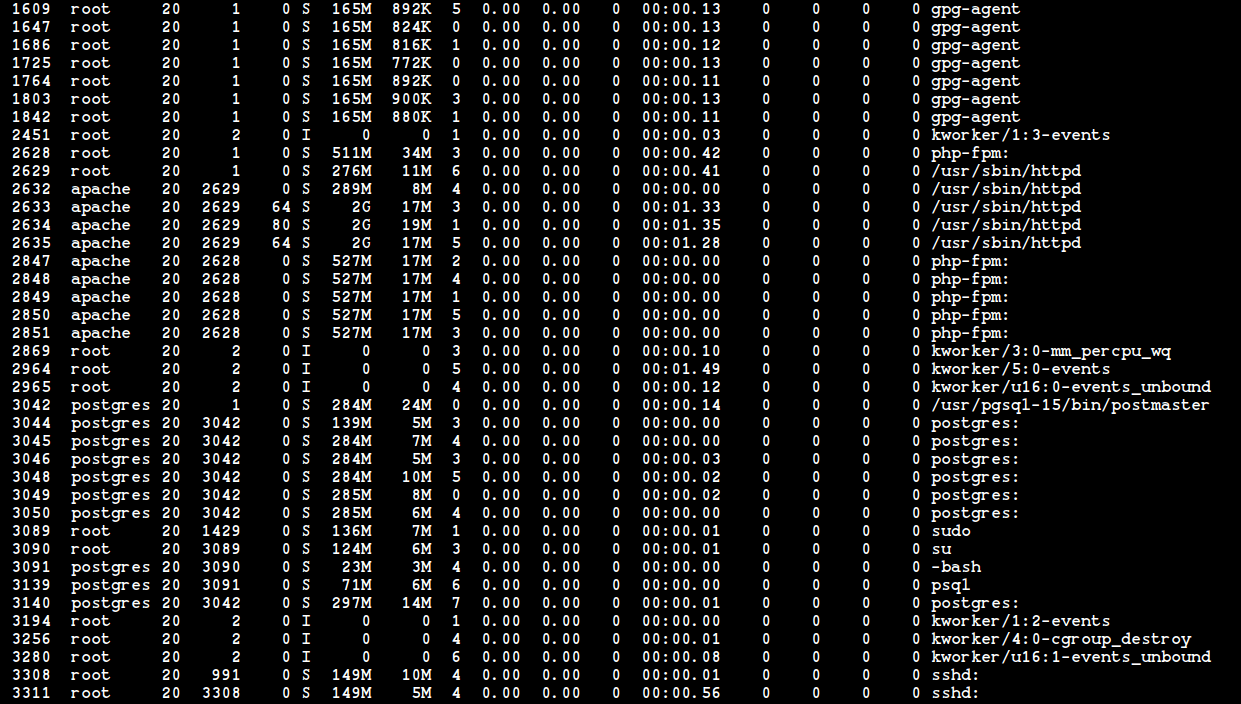
And now last but not least, to use the collectl utility as the ps tool run the following command in your terminal. You will get information about processes in your system the same way as you do when you run the “ps” command in your terminal.
# collectl -c1 -sZ -i:1
I am very sure that many Linux system administrators will like the collectl tool and will feel its power when using it to the fullest. If you like to advance your knowledge about collectl to the next level refer to its manual pages and keep practicing.
Just type the following command in your terminal and start reading.
# man collectl


I’m waiting for Tecmint for a long time to come up with a lustre Parallel file system installation procedure…
@Ramesen,
The long wait is over, we will soon publish an article about How to Install Lustre Software in Linux.
First of all, very useful article; I was looking for some tool just like collectl, so thank you so much for introducing us all to this piece of tool! 1 question, how do I install collectl-utils on centos 7? I’ve been googling about it but so far no luck at all. Thanks again.
Yum install collectl ..is not taking in centos 6.7 after installing perl and also no on centos 7
@masoom: Install the epel-release package (“Extra Packages for Enterprise Linux)..
yum install epel-release
.. and then you can yum install collectl and drool over all of your data points! :)
—
Check it:
[root@localhost m]# yum info collectl
Loaded plugins: fastestmirror, langpacks
Loading mirror speeds from cached hostfile
* base: mirror.atlantic.net
* epel: mirror.us.leaseweb.net
* extras: mirror.atlantic.net
* updates: mirror.atlantic.net
Installed Packages
Name : collectl
Arch : noarch
Version : 4.0.4
Release : 1.el7
Size : 1.6 M
Repo : installed
From repo : epel <————-see?—————–
Summary : A utility to collect various Linux performance data
URL : http://collectl.sourceforge.net
License : GPLv2+ or Artistic
Description : A utility to collect Linux performance data