This article is Part 8 of the LFCA series, here in this part, you will acquaint yourself with the general system administration commands to monitor basic system metricks and schedule administrative tasks in the Linux system.
Keeping tabs on the performance of your system is one of the crucial roles that you will have to undertake as a systems administrator. Sure, there are enough open-source monitoring tools such as Grafana and Nagios for monitoring system metrics.
Thankfully, Linux provides some command-line utilities that enable you to have a glance at some of the vital system stats and information such as CPU and memory utilization and running processes.
Let’s briefly have a look at some of the command-line tools that can help you monitor basic system metrics:
1. uptime Command
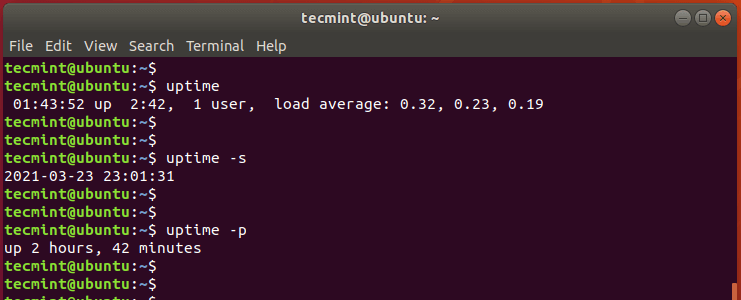
The uptime command provides the duration that the system has been running since it was powered on. Without any command options, it provides the current time, time the system has been up, logged-in users, and the load average.
$ uptime
With the -s option, you get the system’s date and the time the system was turned on.
$ uptime -s
Use the -p option, to get the uptime only
$ uptime -p
2. free Command
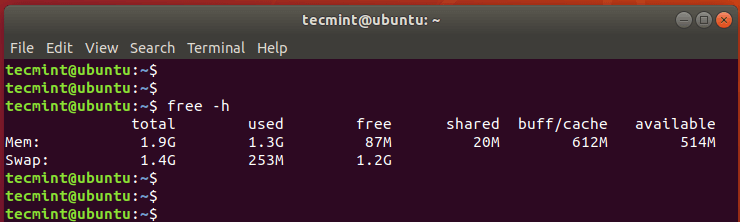
To get a glimpse of the total and available memory and swap space on your system, use the free command as follows. The -h option prints out the output in a human-readable format.
$ free -h
3. top Command
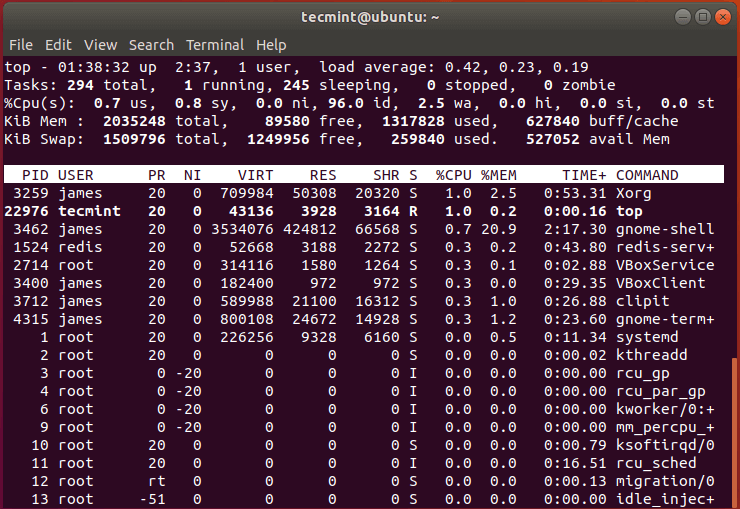
The top command does two things: it provides a summary of the real-time system metrics and displays the currently running processes that are managed by the Linux kernel.
In addition to displaying the running processes, the top command combines the output provided by uptime and free commands which is located at the very top.
$ top
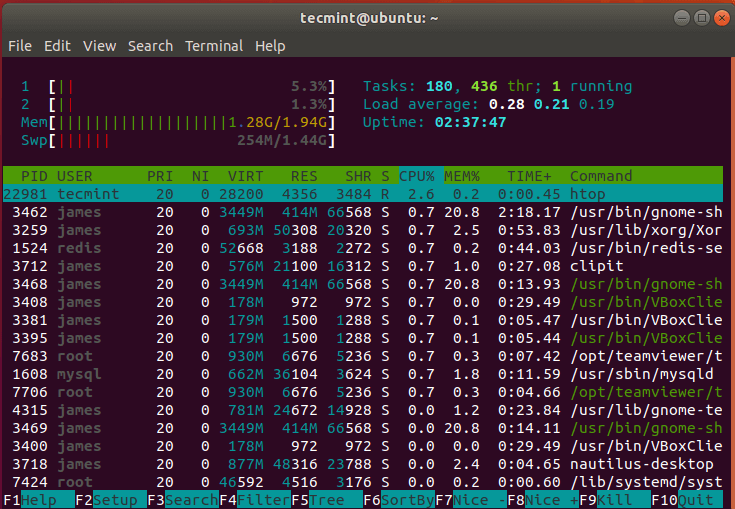
An improvement of top command is the htop utility which displays the statistics in an intuitive and human readable format.
On Linux, you can install htop using the command:
$ sudo apt install htop  [On Debian-based]
$ sudo dnf install htop  [On RHEL-based]
To launch htop simply run the command:
$ htop
4. df Command
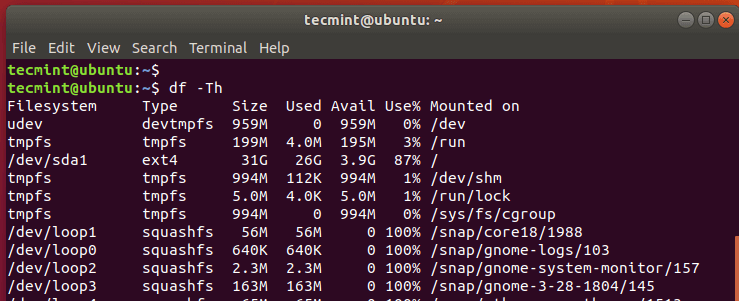
We’ve previously discussed the df (disk-free) utility in basic Linux commands. The df command provides information on hard disk utilization per filesystem. Use the -Th flag to print information in a human-readable format.
$ df -Th
5. View CPU Information
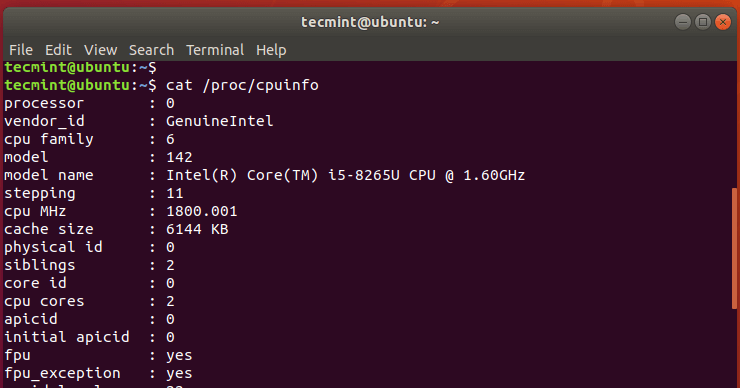
To view CPU information such as vendor id, processor cores, model name and so much more, run the command:
$ cat /proc/cpuinfo
Automate System Administration Tasks
Scheduling tasks or jobs to take place at a predefined time is one of the core skills that any Systems administrator should have. You might want to schedule administrative tasks that need to happen regularly such as backups and periodic reboots.
Cron is a time scheduler that helps to automate tasks. The cron facility comprises the cron daemon and a set of tables from which it reads its configuration called the crontab. The crontab describes the tasks to be executed.
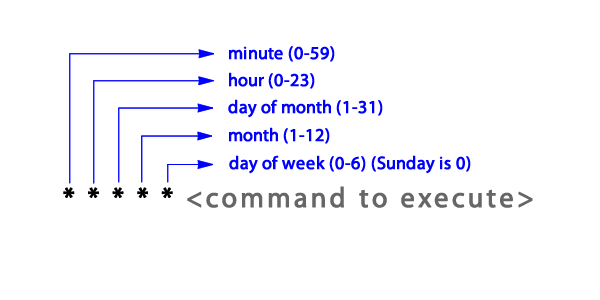
To create a cron job, we must first understand its architecture. A cron job consists of five fields which are followed by the command or script to be executed. Here’s a diagrammatic representation of the various fields of a cron job.
Let’s explore some of the cron examples and their interpretations:
0	12	*	*	*   <command>   Executes a task daily  at noon
30	06	*	*	*   <command>   Executes a task daily  at 6:30 am
30      *	*	*	*   <command>   Executes a task  every 30 minutes
0	0	*	*	*   <command>   Executes a task  at midnight
30	06	*	* 	5   <command>  Executes a task at 6:30 am every Fri
*	* 	*	* 	*   <command>  Executes a task every minute
0	0	1	* 	*   <command>  Executes a task at midnight on the first day of every month
0	3 	*	* 	Mon-fri   <command> Executes a task at 3:00am on every day of the week from Monday to Friday.
Let’s now create a cron job.
First, We are going to create a backup script that backs up our Downloads folder in /home/tecmint/Downloads to the /home/documents directory.
Using the vim editor, we will create and open the script file as shown.
$ vim backup.sh
We will begin with a shebang header at the very top to mark the beginning of the shell script
#!/bin/bash
The command for backing up the directories folder is shown below.
tar -cvf /home/tecmint/Documents/downloads.tar.gz /home/tecmint/Downloads
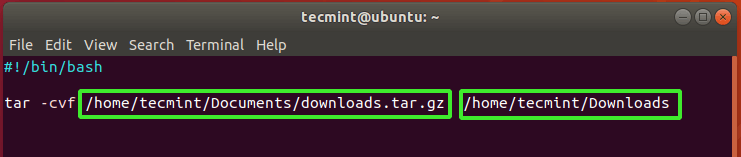
The first path represents the full path to the backup file which is downloads.tar.gz, while the second path points to the path of the directory to be backed up.
Save the file by pressing ESC then type :wq and press ENTER.
Next, assign execute permissions to the backup script. This is necessary so that the cron utility can execute the script.
$ chmod +x backup.sh
To create a cron job to execute the script, run the following command:
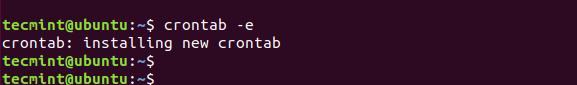
$ crontab -e
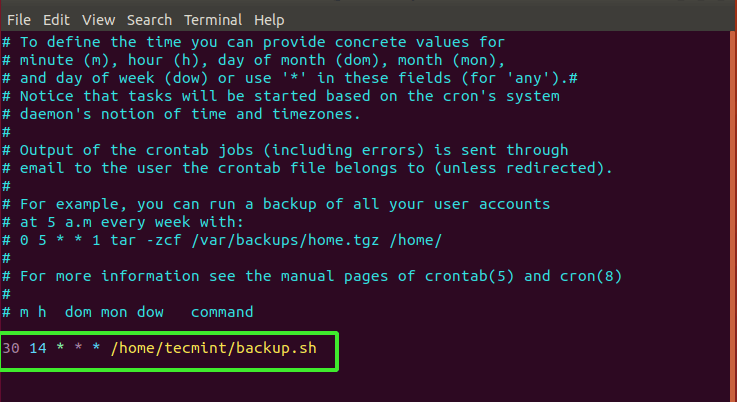
We will define the cron job to run the backup script every day at 14:30 HRS as follows
30 14 * * * /home/tecmint/backup.sh
Save the file by pressing ESC then type :wq and press ENTER. Once you exit from the file, you will get a prompt crontab: installing a new crontab implying that the cron job has been initialized.
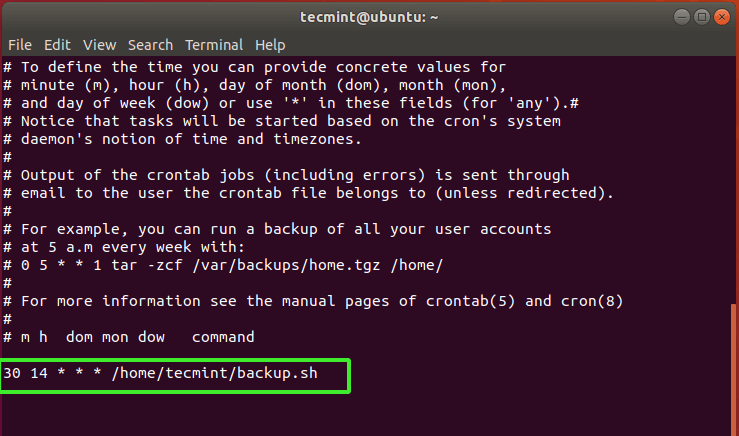
To list the current cron jobs run the command:
$ crontab -l
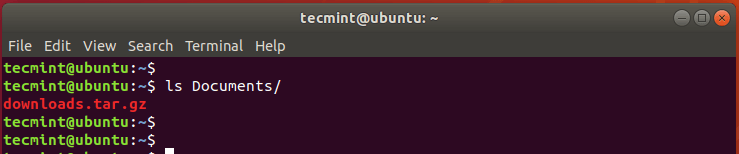
So, for our backup task, the cron job successfully created a compressed file of the ‘Downloads’ directory in the ‘Documents’ directory once the clock struck 14:30 HRS.
$ ls Documents/
If you no longer want a cron job, you can delete it using the command:
$ crontab -r
Conclusion
There are several other tasks that system administrators perform on a daily basis such as inventory taking and so much more.


The “List Cron Jobs” image does not show the output of the “crontab -l” command. Is exactly the same as the “Create Cron Job in Linux” image.
The difference between the two is that when you are creating a cron job for the first time using the ‘crontab -e‘ command, you are basically opening the crontab file in a text editor ( vim editor in my case ) and defining your cron job. As you can clearly see, the file is opened in vim editor from the color-coded entries.
When you are listing the cronjobs using the crontab -l command, the cron command simply lists all the entries in the crontab including your cron job. This is more like using the cat command to view the contents of a file.
James and/or Ravi,
The 3rd cron job is edited like this
but should be instead
Gérard
@Gerard,
Thanks, corrected the command in the article…