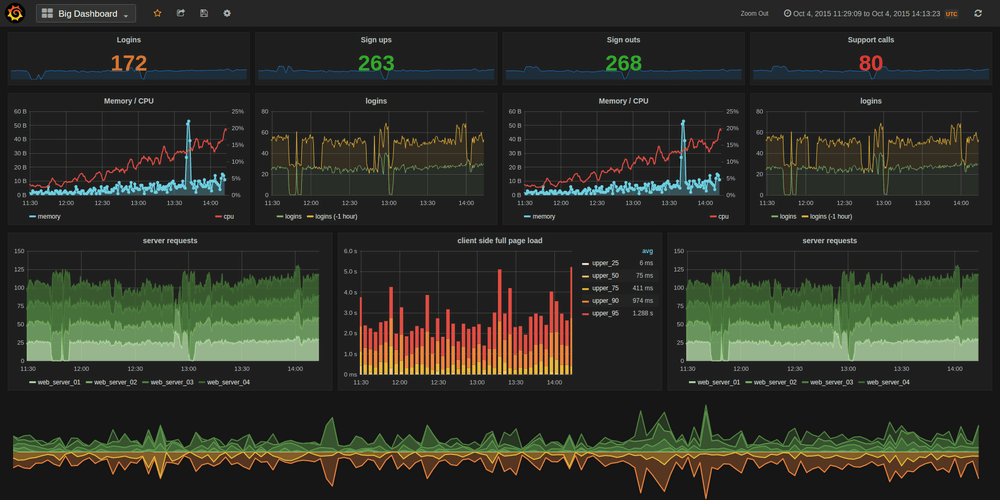
Grafana is an open source, feature rich, powerful, elegant and highly-extensible analytics and monitoring software that runs on Linux, Windows and MacOS. It is a de facto software for data analytics, being used at Stack Overflow, eBay, PayPal, Uber and Digital Ocean – just to mention but a few.
It supports 30+ open source as well as commercial databases/data sources including MySQL, PostgreSQL, Graphite, Elasticsearch, OpenTSDB, Prometheus and InfluxDB. It allows you to dig deeply into large volumes of real-time, operational data; visualize, query, set alerts and get insights from your metrics from different storage locations.
Read Also: How to Install Piwik (Google Analytics) Software in Linux
Importantly, Grafana allows for setting up multiple, independent organizations with each having their own usage environment (admins, data sources, dashboards and users).
Grafana Features:
- Elegant graphics for data visualization.
- Fast and flexible graphs with numerous options.
- Dynamic and reusable dashboards.
- It’s highly extensible using hundreds of dashboards and plugins in the official library.
- Supports power user preferences.
- Supports multi tenancy, setup multiple independent organizations.
- Supports authentication via LDAP, Google Auth, Grafana.com, and Github.
- Supports notifications via Slack, PagerDuty, and more.
- Remarkably supports collaboration by allowing sharing of data and dashboards across teams and so much more.
An online demo is available for you to try before installing Grafana on your Linux distribution.
Demo URL: http://play.grafana.org/
In this article, we will explain how to install Grafana – Data Visualization & Monitoring software on CentOS, Debian and Ubuntu distributions.
Install Grafana in Linux Systems
1. We will install Grafana from its official YUM or APT repositories, so that you can update it using your default package manager.
Install Grafana on Debian and Ubuntu
$ echo "deb https://packagecloud.io/grafana/stable/debian/ stretch main" | sudo tee -a /etc/apt/sources.list
$ curl https://packagecloud.io/gpg.key | sudo apt-key add -
$ sudo apt-get update
$ sudo apt-get install grafana
Install Grafana on CentOS, RHEL and Fedora
# echo "[grafana]
name=grafana
baseurl=https://packagecloud.io/grafana/stable/el/7/$basearch
repo_gpgcheck=1
enabled=1
gpgcheck=1
gpgkey=https://packagecloud.io/gpg.key https://grafanarel.s3.amazonaws.com/RPM-GPG-KEY-grafana
sslverify=1
sslcacert=/etc/pki/tls/certs/ca-bundle.crt" | sudo tee /etc/yum.repos.d/grafana.repo

# yum install grafana
2. After installing Grafana, you can find important files in the following locations:
- Installs binary to /usr/sbin/grafana-server
- Installs Init.d script to /etc/init.d/grafana-server
- Creates default file (environment vars) to /etc/default/grafana-server
- Installs configuration file to /etc/grafana/grafana.ini
- Installs systemd service name grafana-server.service
- The default configuration sets the log file at /var/log/grafana/grafana.log
- The default configuration specifies an sqlite3 db at /var/lib/grafana/grafana.db
- Installs HTML/JS/CSS and other Grafana files at /usr/share/grafana
3. Next, start the Grafana service, check if it is up and running, then enable it to auto-start at boot time as follows. By default, the process is run as the grafana user (created during the installation process), and listens on HTTP port 3000.
Start Grafana Server (via Systemd)
# systemctl daemon-reload
# systemctl start grafana-server
# systemctl status grafana-server
# systemctl enable grafana-server
Start Grafana Server (via init.d)
# service grafana-server start
# service grafana-server status
# sudo update-rc.d grafana-server defaults  [On Debian/Ubuntu]
# /sbin/chkconfig --add grafana-server      [On CentOS/RHEL/Fedora]
4. If your system has a firewall enabled by default, you need to open the port 3000 in the firewall to allow client requests to the grafana process.
-----------  [On Debian/Ubuntu] -----------
$ sudo ufw allow 3000/tcp
$ sudo ufw reload

-----------  [On CentOS/RHEL/Fedora] -----------
# firewall-cmd --permanent --add-port=3000/tcp
# firewall-cmd --reload
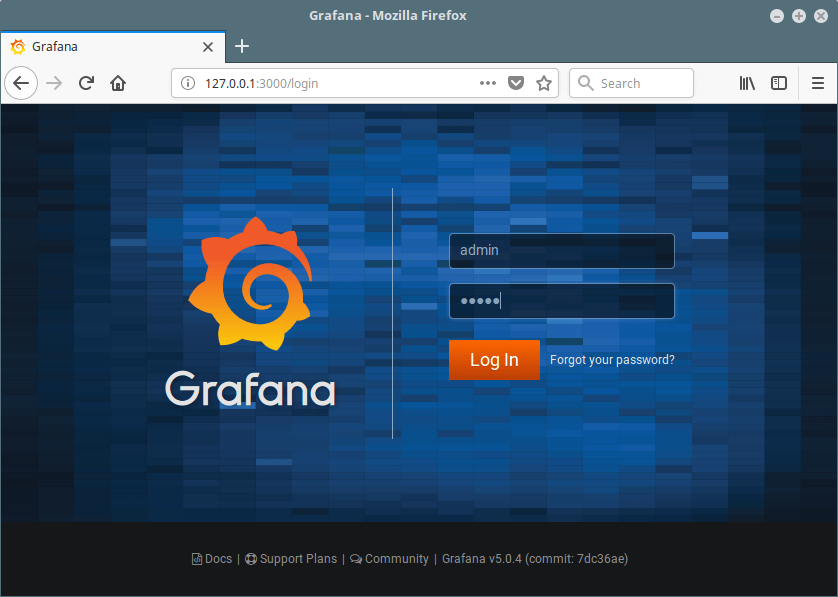
5. Now use the following URL to access the Grafana, which will redirect to the login page, user credentials as username: admin and password: admin)
http://Your-Domain.com:3000
OR
http://IP-Address:3000
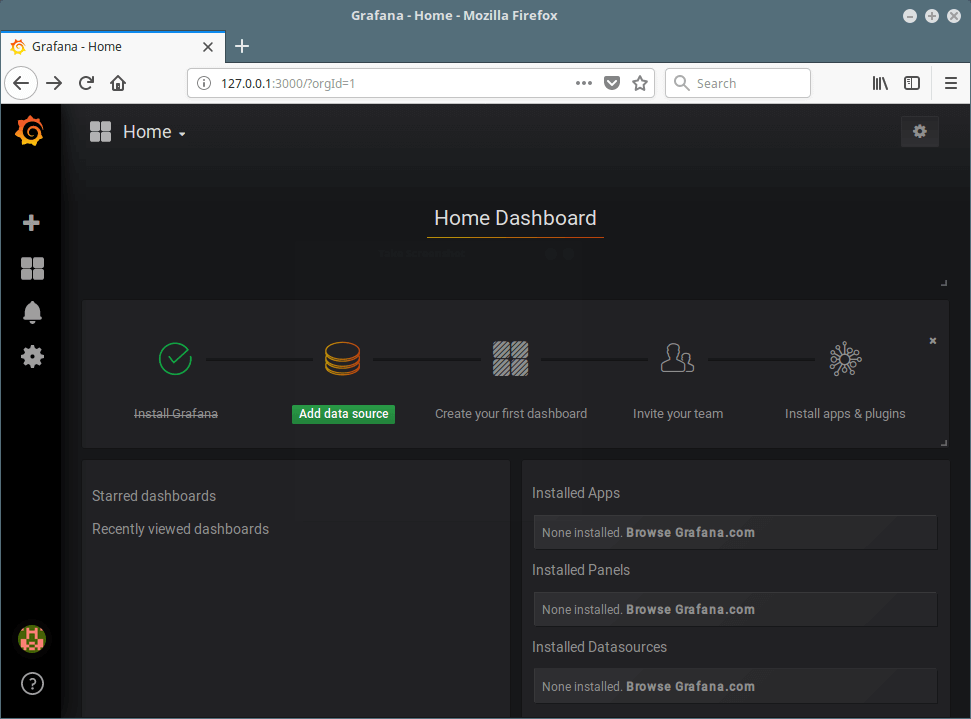
6. After login, you will access the home dashboard, as shown in the screenshot below.
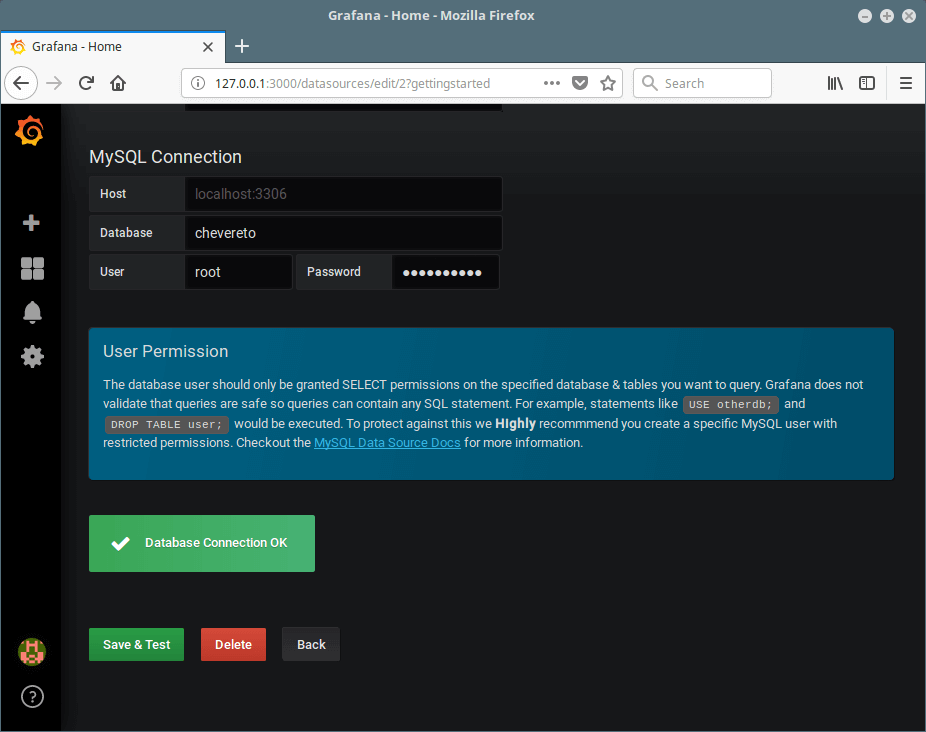
7. Next, add a database or data source, click on “Add Data Source”. For example we will add a MySQL database; specify the data source name, type, and connection parameters. Then click on Save & Test.

You will be notified if the database connection is successful or it has failed, as shown in the screenshot. Then go back to the home dashboard to add a new dashboard.
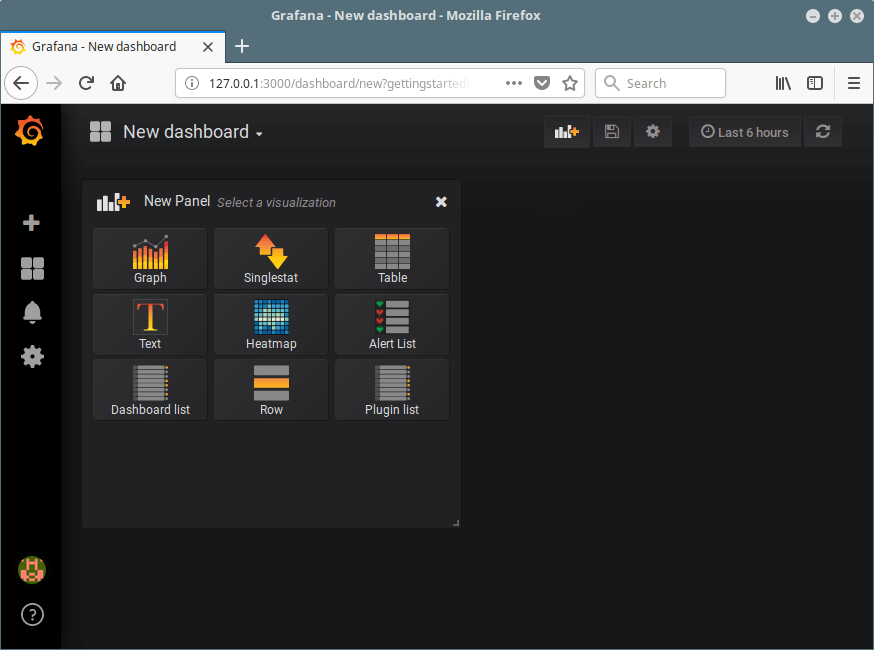
8. From the Home dashboard, click on New dashboard to add a new panel for visualizing metrics from your data source.
From here, you can add more data sources, dashboards, invite your team members, install apps and plugins to extend the default functionalities, and do more.
You can find more information from the Grafana Homepage: https://grafana.com/
Grafana is an elegant software for real-time data analytics and monitoring. We hope that you successfully installed Grafana on your Linux system, otherwise, use the feedback form below to ask any questions or share your thoughts about it.