Are you using systemd system and service manager, and your Linux system taking longer time to boot or you simple want to view the reports of your system boot-up performance? If yes, you have landed on the right place.
In this article, we will show you how to analyze a Linux system boot-up performance statistics using systemd-analyze, one of numerous utilities under systemd for system management.
Read Also: How to Control Systemd Services on Remote Linux Server
To get an overview of the system boot-up time, we can run systemd-analyze command without any arguments as follows. It will list information about how much time each service took to start, which includes time taken by kernel, initrd and userspace while booting.
# systemd-analyze

Startup finished in 884ms (kernel) + 3.861s (initrd) + 48.356s (userspace) = 53.102s
If you want to view a list of all running units, sorted by the time they took to initialize (highest time on top), the blame sub-command is used for this purpose. After running the command that follows, use [Enter] to view more services in the list and q to quit.
# systemd-analyze blame
         16.159s mariadb.service
         12.178s libvirtd.service
         10.298s tuned.service
          9.836s postfix.service
          8.704s lsws.service
          7.352s lscpd.service
          4.988s [email protected]
          4.779s NetworkManager-wait-online.service
          4.577s lvm2-monitor.service
          4.439s ModemManager.service
          4.413s polkit.service
          4.280s dev-sda1.device
          4.225s systemd-udev-settle.service
          3.957s firewalld.service
          3.227s rhel-dmesg.service
          3.221s abrt-ccpp.service
          3.142s rsyslog.service
          3.053s avahi-daemon.service
          3.042s pure-ftpd.service
          2.249s gssproxy.service
          2.212s NetworkManager.service
          1.889s proc-fs-nfsd.mount
          1.780s systemd-tmpfiles-setup-dev.service
          1.451s sshd.service
          1.267s rhel-readonly.service
          1.035s sysstat.service
          1.001s rpc-statd-notify.service
           910ms systemd-logind.service
           739ms kdump.service
           738ms network.service
...
As you can see from the above output that each unit is sorted based on the time taken, you can simply find out which service is taking longer time while booting and analyze the issue.
Next, we can also view a tree of the time-critical chain for the default target or a list of specified units with the critical-chain sub-command as shown.
# systemd-analyze critical-chain
The time after the unit is active or started is printed after the "@" character.
The time the unit takes to start is printed after the "+" character.

multi-user.target @48.342s
└─mariadb.service @31.560s +16.159s
  └─network.target @31.558s
    └─network.service @30.819s +738ms
      └─NetworkManager-wait-online.service @26.035s +4.779s
        └─NetworkManager.service @23.821s +2.212s
          └─network-pre.target @23.821s
            └─firewalld.service @19.863s +3.957s
              └─polkit.service @15.381s +4.413s
                └─basic.target @12.271s
                  └─sockets.target @12.271s
                    └─virtlockd.socket @12.270s
                      └─sysinit.target @12.251s
                        └─systemd-update-utmp.service @12.196s +54ms
                          └─auditd.service @11.705s +486ms
                            └─systemd-tmpfiles-setup.service @11.609s +93ms
                              └─rhel-import-state.service @11.397s +211ms
                                └─local-fs.target @11.363s
                                  └─run-user-0.mount @46.910s
                                    └─local-fs-pre.target @10.575s
                                      └─lvm2-monitor.service @5.996s +4.577s
                                        └─lvm2-lvmetad.service @7.376s
                                          └─lvm2-lvmetad.socket @5.987s
                                            └─-.slice
# systemd-analyze critical-chain ntp.service networking.service
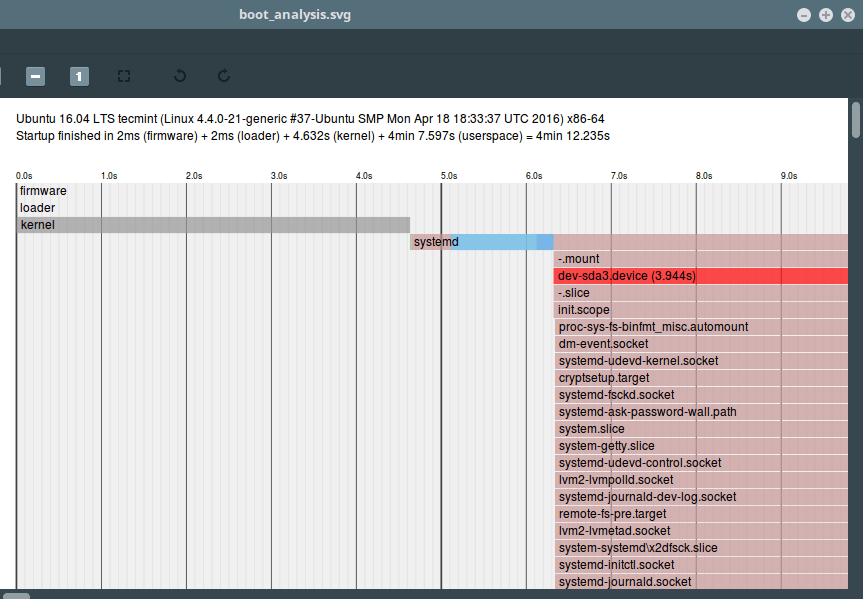
Finally, let’s look at one more important sub-command that allows for producing graphical (svg format) detailing of system services that have been started, and at what time, highlighting their initialization time, as follows.
Make sure graphical display mode or x-windows is enabled in order to view the plot.
# systemd-analyze plot > boot_analysis.svg
# xviewer boot_analysis.svg
All the above commands will print the boot-up performance statistics for the local machine. To view information from a remote host over ssh, use the -H flag and specify the username@host directive, as shown.
# systemd-analyze time -H [email protected]
# systemd-analyze blame -H [email protected]
# systemd-analyze critical-chain -H [email protected]
systemd-analyze can also be used to find other state and tracing information from the system and systemd (service manager) and more. For more information, see its man page.
# man systemd-analyze
Read Also: How to Change Runlevels (targets) in SystemD
That’s it for now! If you have any questions or thought to share, use the feedback form below to reach us.


