Due to recent modifications in the LFCS certification exam objectives effective from February 2nd, 2016, we are adding the needed articles to the LFCS series published here. To prepare for this exam, you are strongly encouraged to go through the LFCE series as well.

Every Linux system administrator needs to know how to verify the integrity and availability of hardware, resources, and key processes. In addition, setting resource limits on a per-user basis must also be a part of his / her skill set.
In this article we will explore a few ways to ensure that the system both hardware and the software is behaving correctly to avoid potential issues that may cause unexpected production downtime and money loss.
Linux Reporting Processors Statistics
With mpstat you can view the activities for each processor individually or the system as a whole, both as a one-time snapshot or dynamically.
In order to use this tool, you will need to install sysstat:
# yum update && yum install sysstat              [On CentOS based systems]
# aptitutde update && aptitude install sysstat   [On Ubuntu based systems]
# zypper update && zypper install sysstat        [On openSUSE systems]
Read more about sysstat and it’s utilities at Learn Sysstat and Its Utilities mpstat, pidstat, iostat and sar in Linux
Once you have installed mpstat, use it to generate reports of processors statistics.
To display 3 global reports of CPU utilization (-u) for all CPUs (as indicated by -P ALL) at a 2-second interval, do:
# mpstat -P ALL -u 2 3
Sample Output
Linux 3.19.0-32-generic (tecmint.com) 	Wednesday 30 March 2016 	_x86_64_	(4 CPU)

11:41:07  IST  CPU    %usr   %nice    %sys %iowait    %irq   %soft  %steal  %guest  %gnice   %idle
11:41:09  IST  all    5.85    0.00    1.12    0.12    0.00    0.00    0.00    0.00    0.00   92.91
11:41:09  IST    0    4.48    0.00    1.00    0.00    0.00    0.00    0.00    0.00    0.00   94.53
11:41:09  IST    1    2.50    0.00    0.50    0.00    0.00    0.00    0.00    0.00    0.00   97.00
11:41:09  IST    2    6.44    0.00    0.99    0.00    0.00    0.00    0.00    0.00    0.00   92.57
11:41:09  IST    3   10.45    0.00    1.99    0.00    0.00    0.00    0.00    0.00    0.00   87.56

11:41:09  IST  CPU    %usr   %nice    %sys %iowait    %irq   %soft  %steal  %guest  %gnice   %idle
11:41:11  IST  all   11.60    0.12    1.12    0.50    0.00    0.00    0.00    0.00    0.00   86.66
11:41:11  IST    0   10.50    0.00    1.00    0.00    0.00    0.00    0.00    0.00    0.00   88.50
11:41:11  IST    1   14.36    0.00    1.49    2.48    0.00    0.00    0.00    0.00    0.00   81.68
11:41:11  IST    2    2.00    0.50    1.00    0.00    0.00    0.00    0.00    0.00    0.00   96.50
11:41:11  IST    3   19.40    0.00    1.00    0.00    0.00    0.00    0.00    0.00    0.00   79.60

11:41:11  IST  CPU    %usr   %nice    %sys %iowait    %irq   %soft  %steal  %guest  %gnice   %idle
11:41:13  IST  all    5.69    0.00    1.24    0.00    0.00    0.00    0.00    0.00    0.00   93.07
11:41:13  IST    0    2.97    0.00    1.49    0.00    0.00    0.00    0.00    0.00    0.00   95.54
11:41:13  IST    1   10.78    0.00    1.47    0.00    0.00    0.00    0.00    0.00    0.00   87.75
11:41:13  IST    2    2.00    0.00    1.00    0.00    0.00    0.00    0.00    0.00    0.00   97.00
11:41:13  IST    3    6.93    0.00    0.50    0.00    0.00    0.00    0.00    0.00    0.00   92.57

Average:     CPU    %usr   %nice    %sys %iowait    %irq   %soft  %steal  %guest  %gnice   %idle
Average:     all    7.71    0.04    1.16    0.21    0.00    0.00    0.00    0.00    0.00   90.89
Average:       0    5.97    0.00    1.16    0.00    0.00    0.00    0.00    0.00    0.00   92.87
Average:       1    9.24    0.00    1.16    0.83    0.00    0.00    0.00    0.00    0.00   88.78
Average:       2    3.49    0.17    1.00    0.00    0.00    0.00    0.00    0.00    0.00   95.35
Average:       3   12.25    0.00    1.16    0.00    0.00    0.00    0.00    0.00    0.00   86.59
To view the same statistics for a specific CPU (CPU 0 in the following example), use:
# mpstat -P 0 -u 2 3
Sample Output
Linux 3.19.0-32-generic (tecmint.com) 	Wednesday 30 March 2016 	_x86_64_	(4 CPU)

11:42:08  IST  CPU    %usr   %nice    %sys %iowait    %irq   %soft  %steal  %guest  %gnice   %idle
11:42:10  IST    0    3.00    0.00    0.50    0.00    0.00    0.00    0.00    0.00    0.00   96.50
11:42:12  IST    0    4.08    0.00    0.00    2.55    0.00    0.00    0.00    0.00    0.00   93.37
11:42:14  IST    0    9.74    0.00    0.51    0.00    0.00    0.00    0.00    0.00    0.00   89.74
Average:       0    5.58    0.00    0.34    0.85    0.00    0.00    0.00    0.00    0.00   93.23
The output of the above commands shows these columns:
CPU: Processor number as an integer, or the word all as an average for all processors.%usr: Percentage of CPU utilization while running user level applications.%nice: Same as%usr, but with nice priority.%sys: Percentage of CPU utilization that occurred while executing kernel applications. This does not include time spent dealing with interrupts or handling hardware.%iowait: Percentage of time when the given CPU (or all) was idle, during which there was a resource-intensive I/O operation scheduled on that CPU. A more detailed explanation (with examples) can be found here.%irq: Percentage of time spent servicing hardware interrupts.%soft: Same as%irq, but with software interrupts.%steal: Percentage of time spent in involuntary wait (steal or stolen time) when a virtual machine, as guest, is “winning” the hypervisor’s attention while competing for the CPU(s). This value should be kept as small as possible. A high value in this field means the virtual machine is stalling – or soon will be.%guest: Percentage of time spent running a virtual processor.%idle: percentage of time when CPU(s) were not executing any tasks. If you observe a low value in this column, that is an indication of the system being placed under a heavy load. In that case, you will need to take a closer look at the process list, as we will discuss in a minute, to determine what is causing it.
To put the place the processor under a somewhat high load, run the following commands and then execute mpstat (as indicated) in a separate terminal:
# dd if=/dev/zero of=test.iso bs=1G count=1
# mpstat -u -P 0 2 3
# ping -f localhost # Interrupt with Ctrl + C after mpstat below completes
# mpstat -u -P 0 2 3
Finally, compare to the output of mpstat under “normal” circumstances:

As you can see in the image above, CPU 0 was under a heavy load during the first two examples, as indicated by the %idle column.
In the next section we will discuss how to identify these resource-hungry processes, how to obtain more information about them, and how to take appropriate action.
Reporting Linux Processes
To list processes sorting them by CPU usage, we will use the well known ps command with the -eo (to select all processes with user-defined format) and --sort (to specify a custom sorting order) options, like so:
# ps -eo pid,ppid,cmd,%cpu,%mem --sort=-%cpu
The above command will only show the PID, PPID, the command associated with the process, and the percentage of CPU and RAM usage sorted by the percentage of CPU usage in descending order. When executed during the creation of the .iso file, here’s the first few lines of the output:

Once we have identified a process of interest (such as the one with PID=2822), we can navigate to /proc/PID (/proc/2822 in this case) and do a directory listing.
This directory is where several files and subdirectories with detailed information about this particular process are kept while it is running.
For example:
/proc/2822/iocontains IO statistics for the process (number of characters and bytes read and written, among others, during IO operations)./proc/2822/attr/currentshows the current SELinux security attributes of the process./proc/2822/cgroupdescribes the control groups (cgroups for short) to which the process belongs if the CONFIG_CGROUPS kernel configuration option is enabled, which you can verify with:
# cat /boot/config-$(uname -r) | grep -i cgroups
If the option is enabled, you should see:
CONFIG_CGROUPS=y
Using cgroups you can manage the amount of allowed resource usage on a per-process basis as explained in Chapters 1 through 4 of the Red Hat Enterprise Linux 7 Resource Management guide, in Chapter 9 of the openSUSE System Analysis and Tuning guide, and in the Control Groups section of the Ubuntu 14.04 Server documentation.
The /proc/2822/fd is a directory that contains one symbolic link for each file descriptor the process has opened. The following image shows this information for the process that was started in tty1 (the first terminal) to create the .iso image:

The above image shows that stdin (file descriptor 0), stdout (file descriptor 1), and stderr (file descriptor 2) are mapped to /dev/zero, /root/test.iso, and /dev/tty1, respectively.
More information about /proc can be found in “The /proc filesystem” document kept and maintained by Kernel.org, and in the Linux Programmer’s Manual.
Setting Resource Limits on a Per-User Basis in Linux
If you are not careful and allow any user to run an unlimited number of processes, you may eventually experience an unexpected system shutdown or get locked out as the system enters an unusable state. To prevent this from happening, you should place a limit on the number of processes users can start.
To do this, edit /etc/security/limits.conf and add the following line at the bottom of the file to set the limit:
* hard nproc 10
The first field can be used to indicate either a user, a group, or all of them (*), whereas the second field enforces a hard limit on the number of process (nproc) to 10. To apply changes, logging out and back in is enough.
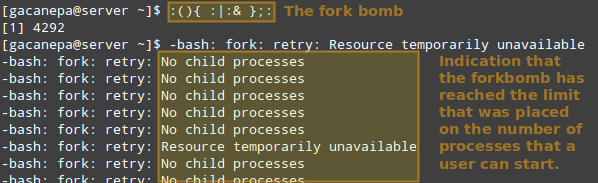
Thus, let’s see what happens if a certain user other than root (either a legitimate one or not) attempts to start a shell fork bomb. If we had not implemented limits, this would initially launch two instances of a function, and then duplicate each of them in a neverending loop. Thus, it would eventually bringing your system to a crawl.
However, with the above restriction in place, the fork bomb does not succeed but the user will still get locked out until the system administrator kills the process associated with it:
TIP: Other possible restrictions made possible by ulimit are documented in the limits.conf file.
Linux Other Process Management Tools
In addition to the tools discussed previously, a system administrator may also need to:
a) Modify the execution priority (use of system resources) of a process using renice. This means that the kernel will allocate more or less system resources to the process based on the assigned priority (a number commonly known as “niceness” in a range from -20 to 19).
The lower the value, the greater the execution priority. Regular users (other than root) can only modify the niceness of processes they own to a higher value (meaning a lower execution priority), whereas root can modify this value for any process, and may increase or decrease it.
The basic syntax of renice is as follows:
# renice [-n] <new priority> <UID, GID, PGID, or empty> identifier
If the argument after the new priority value is not present (empty), it is set to PID by default. In that case, the niceness of process with PID=identifier is set to <new priority>.
b) Interrupt the normal execution of a process when needed. This is commonly known as “killing” the process. Under the hood, this means sending the process a signal to finish its execution properly and release any used resources in an orderly manner.
To kill a process, use the kill command as follows:
# kill PID
Alternatively, you can use pkill to terminate all processes of a given owner (-u), or a group owner (-G), or even those processes which have a PPID in common (-P). These options may be followed by the numeric representation or the actual name as identifier:
# pkill [options] identifier
For example,
# pkill -G 1000
will kill all processes owned by group with GID=1000.
And,
# pkill -P 4993
will kill all processes whose PPID is 4993.
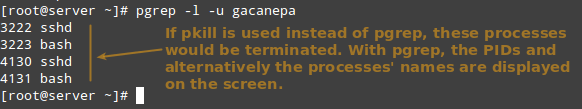
Before running a pkill, it is a good idea to test the results with pgrep first, perhaps using the -l option as well to list the processes’ names. It takes the same options but only returns the PIDs of processes (without taking any further action) that would be killed if pkill is used.
# pgrep -l -u gacanepa
This is illustrated in the next image:
Summary
In this article we have explored a few ways to monitor resource usage in order to verify the integrity and availability of critical hardware and software components in a Linux system.
We have also learned how to take appropriate action (either by adjusting the execution priority of a given process or by terminating it) under unusual circumstances.
We hope the concepts explained in this tutorial have been helpful. If you have any questions or comments, feel free to reach us using the contact form below.