In the past, we’ve covered lots of command-line-based tools for monitoring Linux performance, such as top, htop, atop, glances, and more, and a number of web-based tools such as cockpit, pydash, linux-dash, just to mention but a few. You can also run glances in web server mode to monitor remote servers. But all that aside, we have discovered yet another simple server monitoring tool that we would like to share with you, called Scout_Realtime.
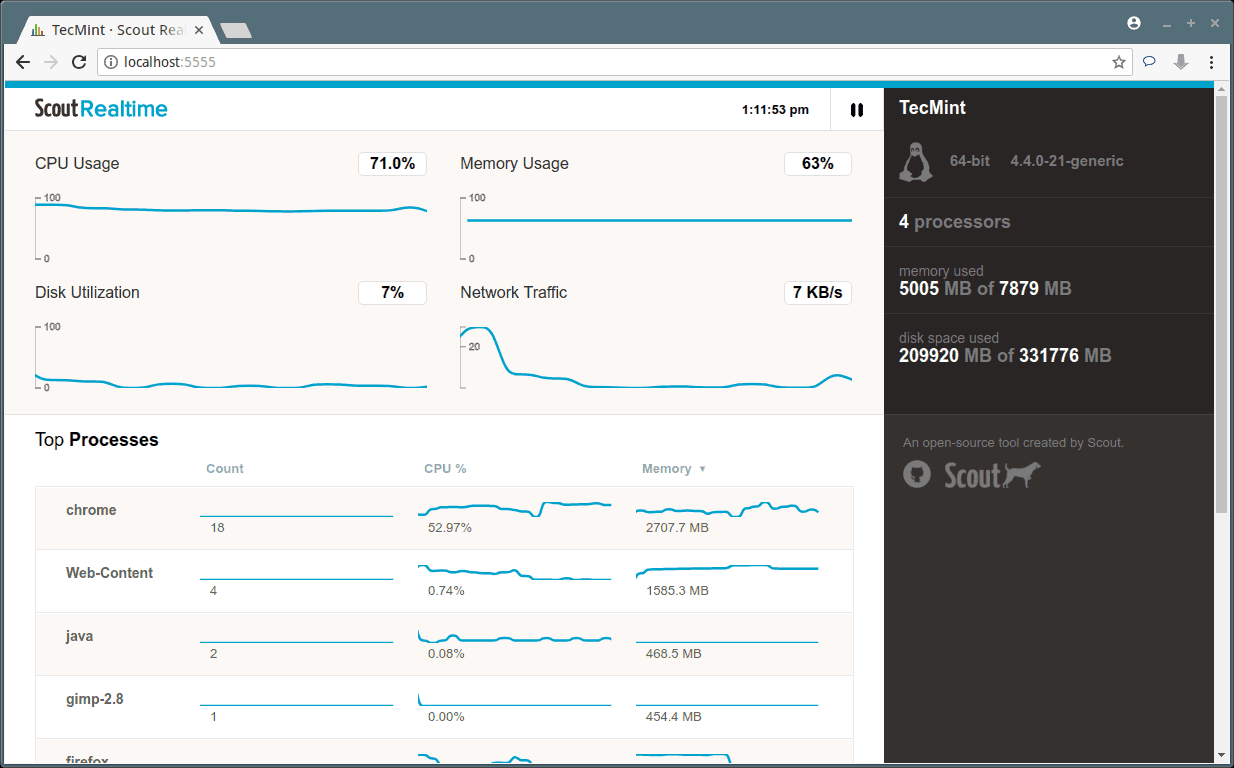
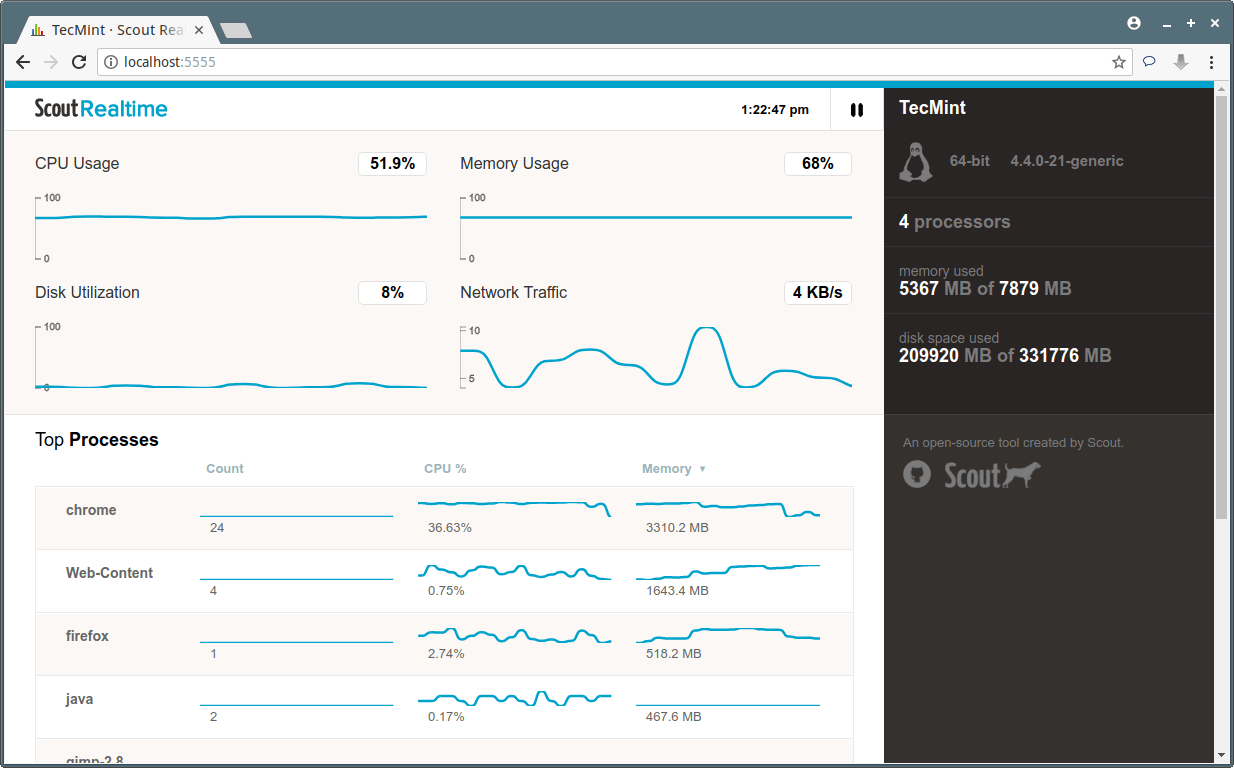
Scout_Realtime is a simple, easy-to-use web-based tool for monitoring Linux server metrics in real-time, in a top-like fashion. It shows you smooth-flowing charts about metrics gathered from the CPU, memory, disk, network, and processes (top 10), in real-time.
In this article, we will show you how to install the scout_realtime monitoring tool on Linux systems to monitor a remote server.
Installing Scout_Realtime Monitoring Tool in Linux
1. To install scout_realtime on your Linux server, you must have Ruby 1.9.3+ installed on your server using the following command.
$ sudo apt-get install rubygems		[On Debian/Ubuntu]
$ sudo yum -y install rubygems-devel	[On RHEL/CentOS]
$ sudo dnf -y install rubygems-devel	[On Fedora 22+]
2. Once you have installed Ruby on your Linux system, now you can install the scout_realtime package using the following command.
$ sudo gem install scout_realtime
3. After successfully installing the scout_realtime package, next, you need to start the scout_realtime daemon which will collect server metrics in real-time as shown.
$ scout_realtime
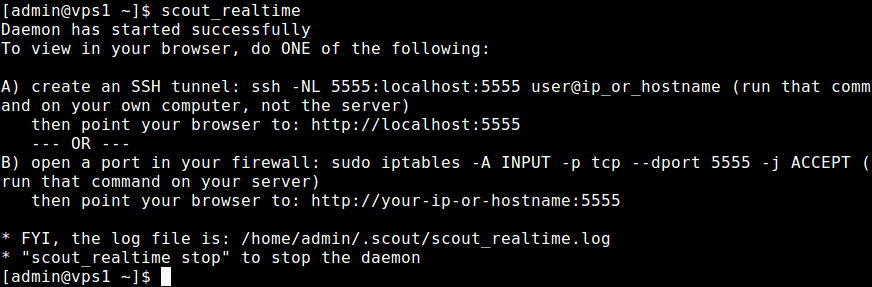
4. Now that the scout_realtime daemon is running on your Linux server that you want to monitor remotely on port 5555. If you are running a firewall, you need to open port 5555 which scout_realtime listens on, in the firewall to allow requests to it.
---------- On Debian/Ubuntu ----------
$ sudo ufw allow 27017
$sudo ufw reload

---------- On RHEL/CentOS 6.x ----------
$ sudo iptables -A INPUT -p tcp --dport 5555 -j ACCEPT
$ sudo service iptables restart

---------- On RHEL/CentOS 7.x ----------
$ sudo firewall-cmd --permanent --add-port=5555/tcp
$ sudo firewall-cmd reload
5. Now from any other machine, open a web browser and use the URL below to access the scout_realtime to monitor your remote Linux server performance.
http://localhost:5555
OR
http://ip-address-or-domain.com:5555
6. By default, scout_realtime logs are written in .scout/scout_realtime.log on the system, which you can view using cat command.
$ cat .scout/scout_realtime.log
7. To stop the scout_realtime daemon, run the following command.
$ scout_realtime stop
8. To uninstall scout_realtime from the system, run the following command.
$ gem uninstall scout_realtime
For more information, check out the Scout_realtime Github repository.
It’s that simple! Scout_realtime is a simple yet useful tool for monitoring Linux server metrics in real-time in a top-like fashion. You can ask any questions or give us your feedback in the comments about this article.


sudo apt-get install rubygems
Reading package lists… Done
Building dependency tree
Reading state information… Done
Some packages could not be installed. This may mean that you have
requested an impossible situation or if you are using the unstable
distribution that some required packages have not yet been created
or been moved out of Incoming.
The following information may help to resolve the situation:
The following packages have unmet dependencies:
rubygems : Depends: ruby1.8 but it is not installable
Recommends: ruby1.8-dev but it is not installable
E: Unable to correct problems, you have held broken packages.
—
sudo apt-get install ruby1
Reading package lists… Done
Building dependency tree
Reading state information… Done
E: Unable to locate package ruby1
—
What now? Raspberry Pi3 ARM
Hi,
a very good article
Thanks a lot
Hi there,
Actually a very good article. Thanks a bunch for a very good job. Nevertheless, I have a question for you guys. Could you tell why on Debian I have to open port 27017 and on other distributions (CentOS and RHEL) port 5555?