When an operating system such as Linux is running, there are many events happening and processes that run in the background to enable efficient and reliable use of system resources. These events may happen in system software for example the init or systemd process or user applications such as Apache, MySQL, FTP, and many more.
In order to understand the state of the system and different applications and how they are working, System Administrators have to keep reviewing log files on a daily basis in production environments.
You can imagine having to review logfiles from several system areas and applications, that is where logging systems come in handy. They help to monitor, review, analyze, and even generate reports from different logfiles as configured by a System Administrator.
In this article, we shall look at the top four most-used open-source logging management systems in Linux today, the standard logging protocol in most if not all distributions today is Syslog.
Table of Contents
1. ManageEngine EventLog Analyzer
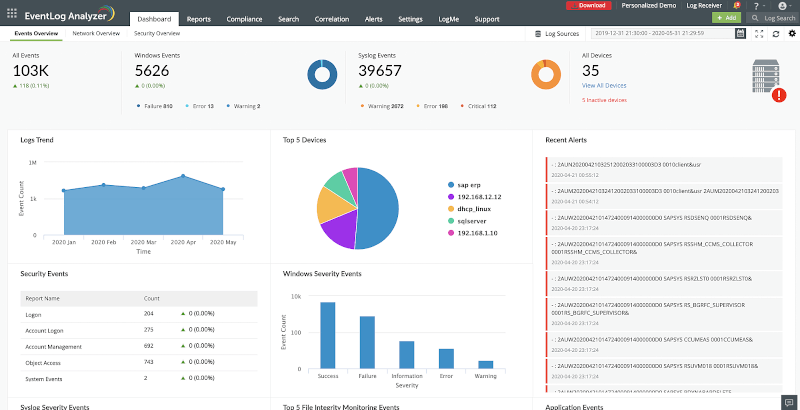
ManageEngine EventLog Analyzer is an on-premise log management solution designed for businesses of all sizes across various industries such as information technology, health, retail, finance, education, and more. The solution provides users with both agent-based and agentless log collection, log parsing capabilities, a powerful log search engine, and log archiving options.
With network device auditing functionality, it enables users to monitor their end-user devices, firewalls, routers, switches, and more in real time. The solution displays analyzed data in the form of graphs and intuitive reports.
EventLog Analyzer’s incident detection mechanisms such as event log correlation, threat intelligence, MITRE ATT&CK framework implementation, advanced threat analytics, and more, help spot security threats as soon as they occur.
The real-time alert system alerts users about suspicious activities, so they can prioritize high-risk security threats. With an automated incident response system, SOCs can mitigate potential threats.
The solution also helps users comply with various IT compliance standards such as PCI DSS, ISO 27001, GLBA, SOX, HIPAA, CCPA, GDPR, and more. Subscription-based services are offered depending on the number of log sources for monitoring. Support is made available to the users via phone, product videos, and an online knowledge base.
2. Graylog 2
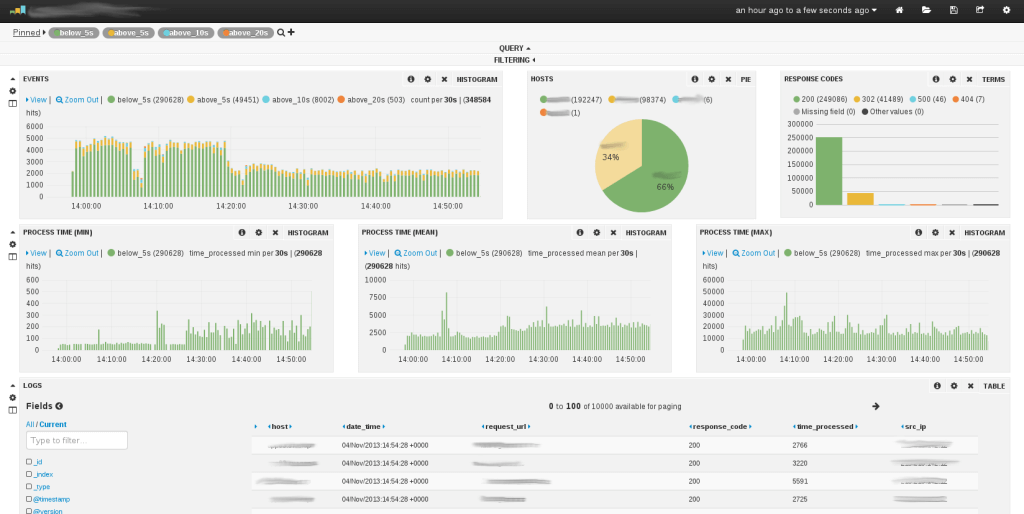
Graylog is a leading open-source and robust centralized logging management tool that is widely used to collect and review logs across various environments including testing and production environments. It is easy to set up and is highly recommended for small businesses.
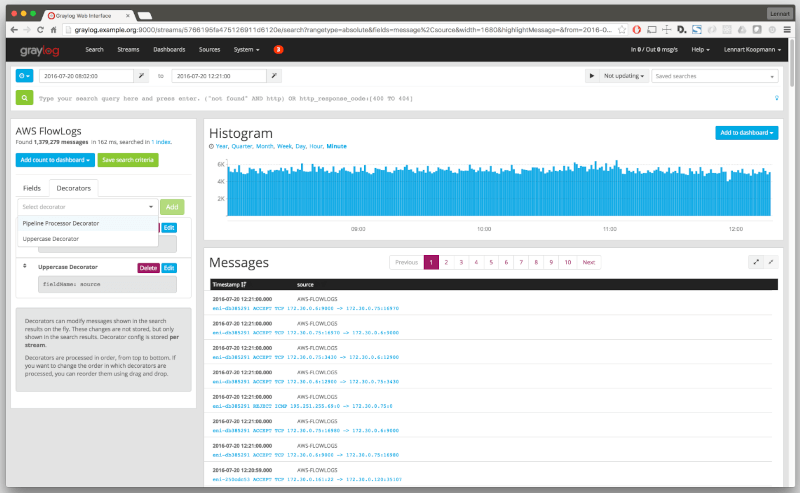
Graylog helps you to easily collect data from multiple devices including network switches, routers, and wireless access points. It integrates with the Elasticsearch analytics engine and leverages MongoDB to store data and the logs collected offer deep insights and are helpful in troubleshooting system faults and errors.
With Graylog, you get a neat and sleepy WebUI with cool dashboards that help you seamlessly track data. Also, you get a set of nifty tools and functionalities that help in compliance auditing, threat search and so much more. You can enable notifications in such a way that an alert is triggered when a certain condition is met or an issue occurs.
Overall, Graylog does a pretty good job of collating large amounts of data and simplifies searching and analyzing data. The latest version is Graylog 5.2.4 and offers new features such as Dark mode, integration with Slack and ElasticSearch and so much more.
3. Logcheck
Logcheck is yet another open-source log monitoring tool that is run as a cron job. It sifts through thousands of log files to detect violations or system events that are triggered. Logcheck then sends a detailed summary of the alerts to a configured email address to alert operation teams of an issue such as an unauthorized breach or a system fault.
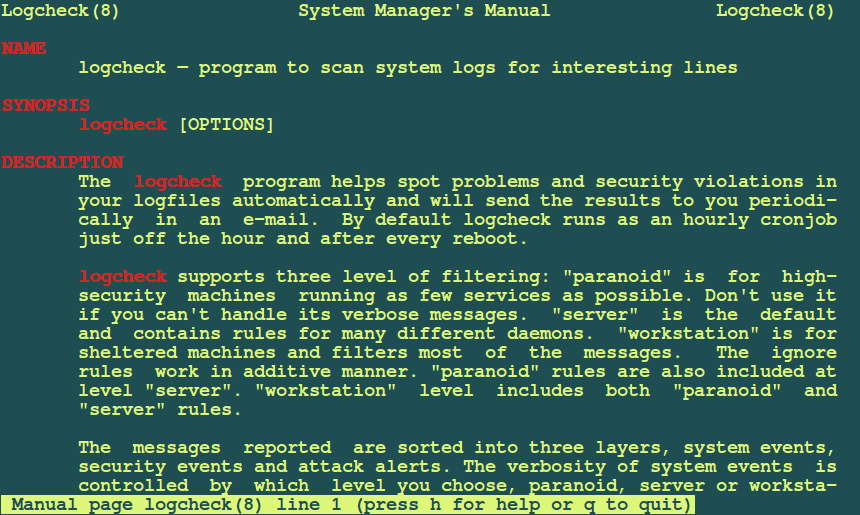
Three different levels of logfile filtering are developed in this logging system which include:
- Paranoid: is intended for high-security systems that are running very few services as possible.
- Server: this is the default filtering level for logcheck and its rules are defined for many different system daemons. The rules defined under the paranoid level are also included under this level.
- Workstation: it is for sheltered systems and helps to filter most of the messages. It also includes rules defined under paranoid and server levels.
Logcheck is also capable of sorting messages to be reported into three possible layers which include, security events, system events, and system attack alerts. A System Administrator can choose the level of details to which system events are reported depending on the filtering level though this does not affect security events and system attack alerts.
Logcheck provides the following features:
- Predefined report templates.
- A mechanism for filtering logs using regular expressions.
- Instant email notifications.
- Instant security alerts.
4. Logwatch
Logwatch is an open-source and highly customizable log collection and analysis application. It parses both system and application logs and generates a report on how applications are running. The report is delivered either on the command line or through a dedicated email address.
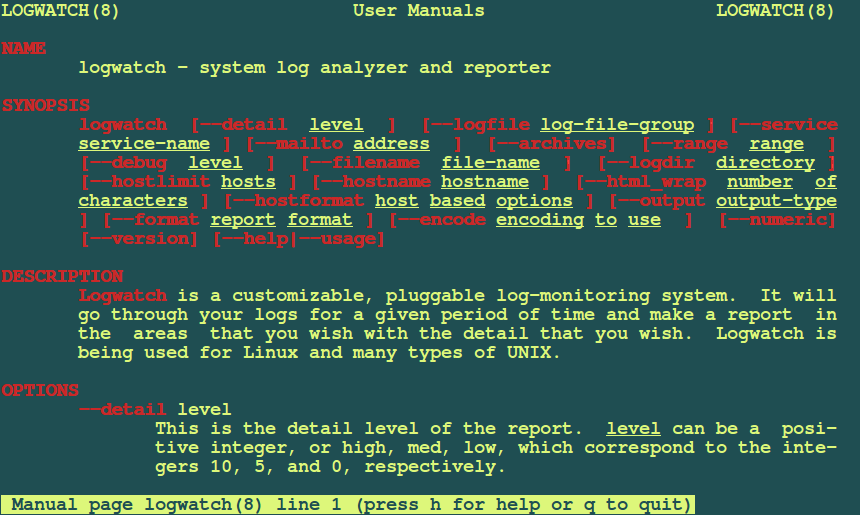
You can easily customize Logwatch to your preference by modifying the parameters in the /etc/logwatch/conf path. It also provides something extra in the way of pre-written PERL scripts for making log parsing easier.
Logwatch comes with a tiered approach and there are 3 main locations where configuration details are defined:
- /usr/share/logwatch/default.conf/*
- /etc/logwatch/conf/dist.conf/*
- /etc/logwatch/conf/*
All the default settings are defined in the /usr/share/logwatch/default.conf/logwatch.conf file. The recommended practice is to leave this file intact and instead create your own configuration file at the /etc/logwatch/conf/ path by copying the original config file and then defining your custom settings.
The latest version of Logwatch is version 7.10 and it provides support for querying the systemd journal directly using journalctl. If you cannot afford a proprietary log management tool, Logwatch will give you peace of mind in knowing that all events will be logged and notifications delivered in case something goes amiss.
5. Logstash
Logstash is an open-source server-side data processing pipeline that accepts data from a multitude of sources including local files, or distributed systems like S3. It then processes the logs and funnels them to platforms such as Elasticsearch where they are analyzed and archived later on. It’s quite a powerful tool as it can ingest volumes of logs from multiple applications and later output them to different databases or engines all at the same time.
Logstash structures unstructured data and performs geolocation lookups anonymizes personal data, and scales across multiple nodes as well. There’s an extensive list of data sources that you can have Logstash listen to pipe including SNMP, heartbeats, Syslog, Kafka, puppet, windows event log, etc.
Logstash relies on ‘beats’ which are lightweight data shippers that feed data to Logstash for parsing and structuring etc. Data is then sent to other destinations such as Google Cloud, MongoDB, and Elasticsearch for indexing. Logstash is a key component of Elastic Stack that allows users to collate data in any form, parse it and visualize it on interactive dashboards.
What’s more, is that Logstash enjoys widespread community support and regular updates.
Summary
That is it for now and remember that these are not all the available log management systems that you can use on Linux. We shall keep reviewing and updating the list in future articles, I hope you find this article useful and you can let us know of other important logging tools or systems out there by leaving a comment.


I haven’t heard of Logcheck before – I’ll have to check it out, thanks!
Logstash used to be very popular, but there are lighter log shipper now – e.g. Filebeat from Elastic or Logagent from Sematext.
@Otis
Many thanks for feedback, we will also have to check out Filebeat from Elastic or Logagent from Sematext.
Another free and open source log management solution you may want to check out is NXLog, it is scalable and delivers high performance.
@Robin
Thanks a lot for mentioning this, we will check it out.
I have been started using the GrayLog 2 for my Production / Development servers Logs.
But I’m finding it difficult in sending all the logs from httpd, mongodb etc.. If any one of you have good practical experience in configuring the Graylog 2 with the Extractor please help me.
@Maclean,
That’s really good to know that you’ve using GrayLog 2 for your production, I just wanted to know how good is this tool regarding collecting server logs? and why you want to send all logs from httpd or mongodb? I really didn’t understand here, what you’re trying to do so? I never tried GrayLog 2 yet, but will give a try today..
Hi Ravi,
The main reason I’m going into the Graylog2 is because for its versatility of collecting the logs from different systems (firewalls, servers, application etc…) and i can create my custom Extractor for filtering the logs. Graylog2 server nodes can be expanded to support the Elastic search (1 web node, 3 Elastic Server node, 2 Data nodes) –> This is expandable as we need.
A simple example i want a logs to be send is a specified format i can use the json and create the logs format and send it to my GrayLog2 by this we can manage many things inside the application events.
From the http you have access and error logs if you can send this log details we can get Who all are accessing, what url failed to deliver and errors in the java scripts or icon load or path issue etc…
But I’m still a beginner on this Apps. But the hardest part is writing the Extractor.
@Maclean,
Thanks for detailed explanation, now I know why Graylog2 is more powerful than any other logs tools, I think I should give a try…
Try Netdata https://github.com/firehol/netdata
@David,
Thanks for suggesting Netdata tool, we know about it and in fact we’ve detailed guide on same at https://www.tecmint.com/netdata-real-time-linux-performance-network-monitoring-tool/
Graylog 2 vs Logstash. Which system is better?
Both are good to go with, since Graylog 2 allows a user to work with log files from different sources, i would go with it. But testing how both work would only help you make a fair judgment.
I was going to ask this exact question….
What about Splunk?
Good mentioning it out to users…..
It’s not opensource AFAIK