Memory management, particularly monitoring memory usage, is crucial for your Linux system. There are many tools available across different Linux distributions to monitor memory usage, each functioning in distinct ways.
In this how-to guide, we will explore a smem reporting tool that can help you report memory consumption on a per-process and per-user basis in a Linux environment.
How to Install Smem – Memory Reporting Tool in Linux
smem is a command-line memory reporting tool that gives a user diverse reports on memory usage on a Linux system. There is one unique thing about smem, unlike other traditional memory reporting tools, it reports PSS (Proportional Set Size), a more meaningful representation of memory usage by applications and libraries in a virtual memory setup.
Existing traditional tools focus mainly on reading RSS (Resident Set Size) which is a standard measure to monitor memory usage in a physical memory scheme, but tends to overestimate memory usage by applications.
PSS on the other hand, gives a reasonable measure by determining the “fair-share” of memory used by applications and libraries in a virtual memory scheme.
Features of smem tool:
- System overview listing
- Listings and also filtering by process, mappings or user
- Using data from /proc filesystem
- Configurable listing columns from several data sources
- Configurable output units and percentages
- Easy to configure headers and totals in listings
- Using data snapshots from directory mirrors or compressed tar files
- Built-in chart generation mechanism
- Lightweight capture tool used in embedded systems
Install Smem in Linux
To install Smem on Linux, use the following appropriate command for your specific Linux distribution.
sudo apt install smem         [On Debian, Ubuntu and Mint]
sudo yum install smem         [On RHEL/CentOS/Fedora and Rocky/AlmaLinux]
sudo emerge -a sys-apps/smem  [On Gentoo Linux]
sudo apk add smem             [On Alpine Linux]
sudo pacman -S smem           [On Arch Linux]
sudo zypper install smem      [On OpenSUSE]
sudo pkg install smem         [On FreeBSD]
Display Linux Memory Usage Statistics
To view a report of memory usage across the whole system, by all system users, run the following command:
sudo smem
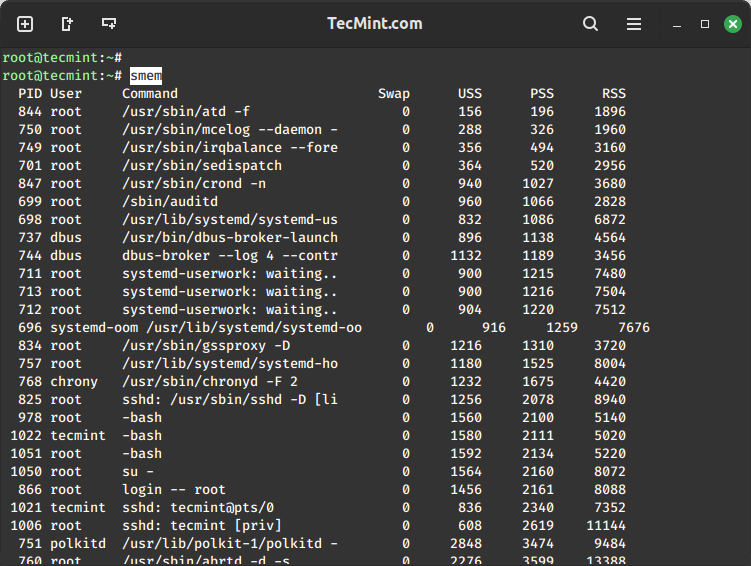
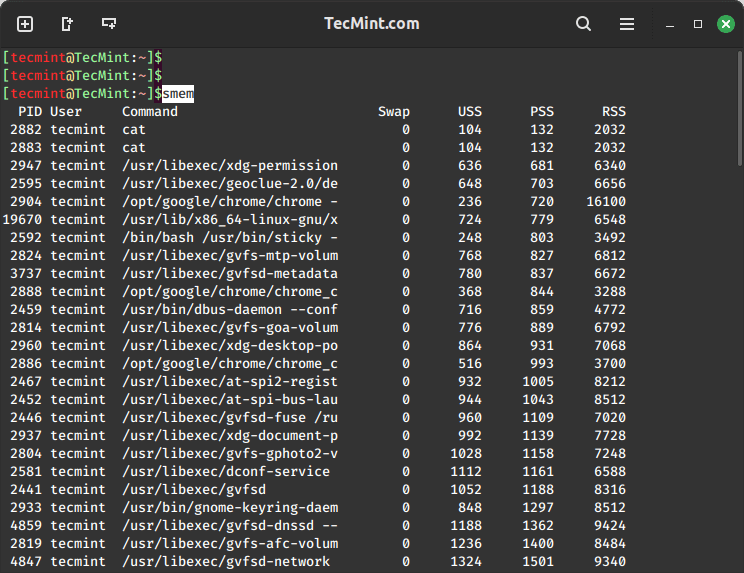
When a normal user runs smem, it displays memory usage by a process that the user has started, the processes are arranged in order of increasing PSS.
Take a look at the output below on my system for memory usage by processes started by the user tecmint:
smem
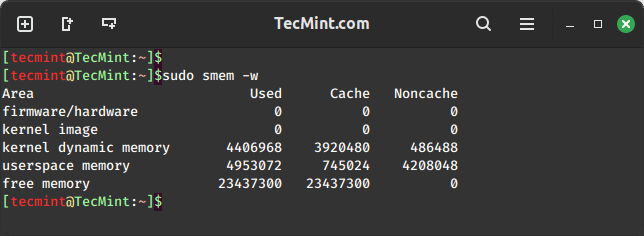
There are many options to invoke while using smem, for example, to view system-wide memory consumption, run the following command:
sudo smem -w
Display Memory Usage Per User in Linux
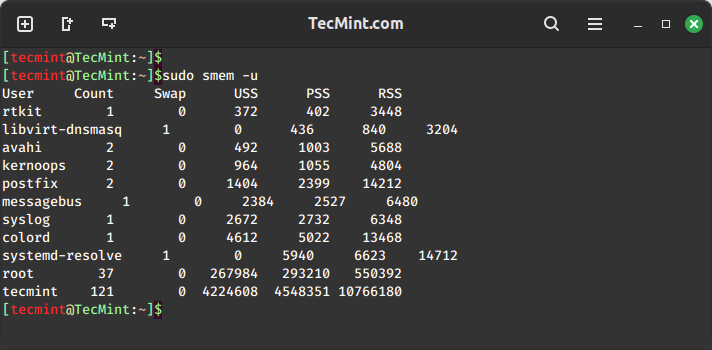
To view memory usage on a per-user basis, run the command below:
sudo smem -u
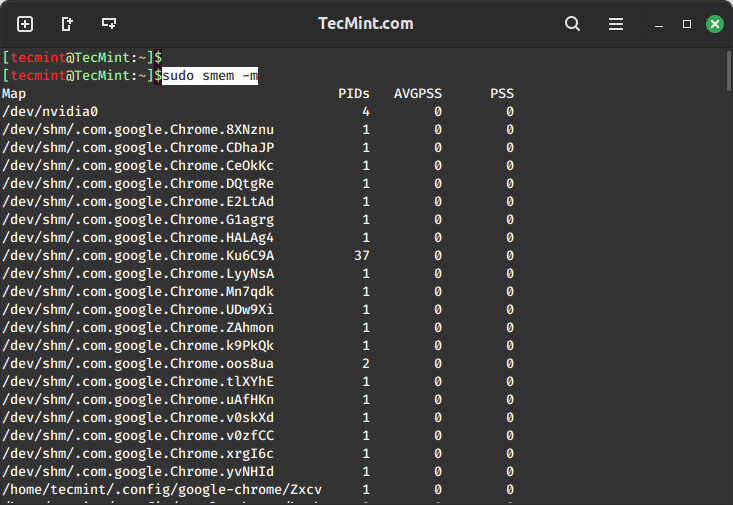
You can also report memory usage statistics by mappings as follows:
sudo smem -m
Display Memory Usage Per Processes in Linux
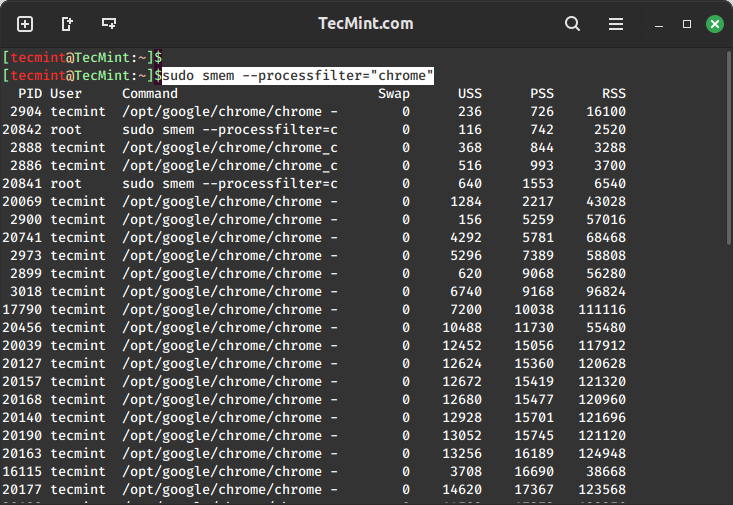
To filter output by process name, invoke the -P or --processfilter="regex" option as follows:
sudo smem --processfilter="chrome"
Output formatting can be very important, and there are options to help you format memory reports we shall look at a few examples below.
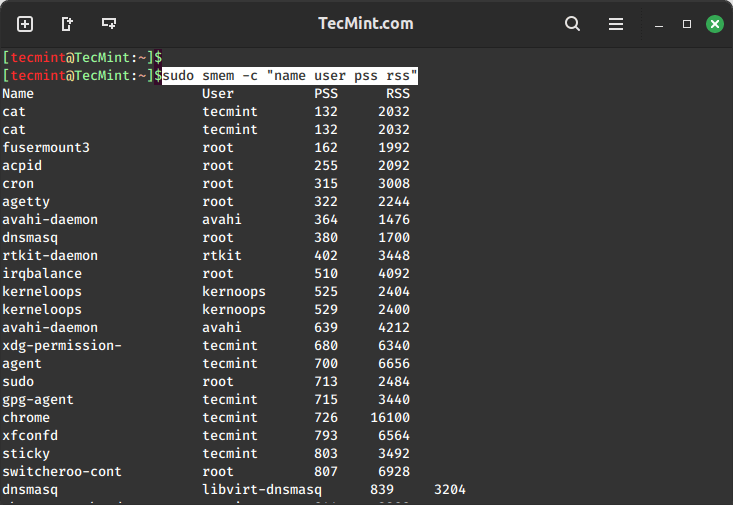
To show desired columns in the report, use -c or --columns option as follows:
sudo smem -c "name user pss rss"
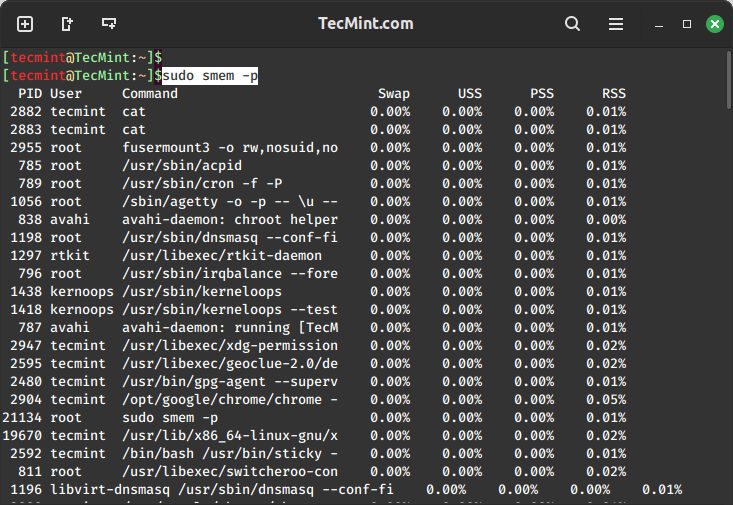
You can invoke the -p option to report memory usage in percentages, as in the command below:
sudo smem -p
The command below will show totals at the end of each column of the output:
sudo smem -t
Display Visual Representation of Memory Usage
Furthermore, there are options for graphical reports that you can also use and we shall dive into them in this sub-section.
You can produce a bar graph of processes and their PSS and RSS values, in the example below, we produce a bar graph of processes owned by the root user.
The vertical plane shows the PSS and RSS measure of processes and the horizontal plane represents each root user process:
sudo smem --userfilter="root" --bar pid -c"pss rss"
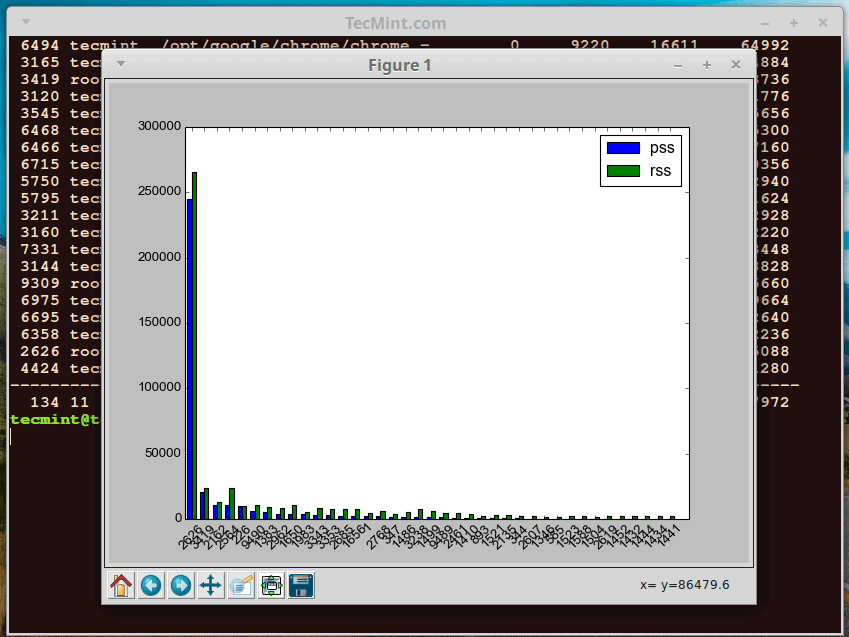
You can also produce a pie chart showing processes and their memory consumption based on PSS or RSS values. The command below outputs a pie chart for processes owned by the root user measuring values.
The --pie name means label by name and -s option helps to sort by PSS value.
sudo smem --userfilter="root" --pie name -s pss
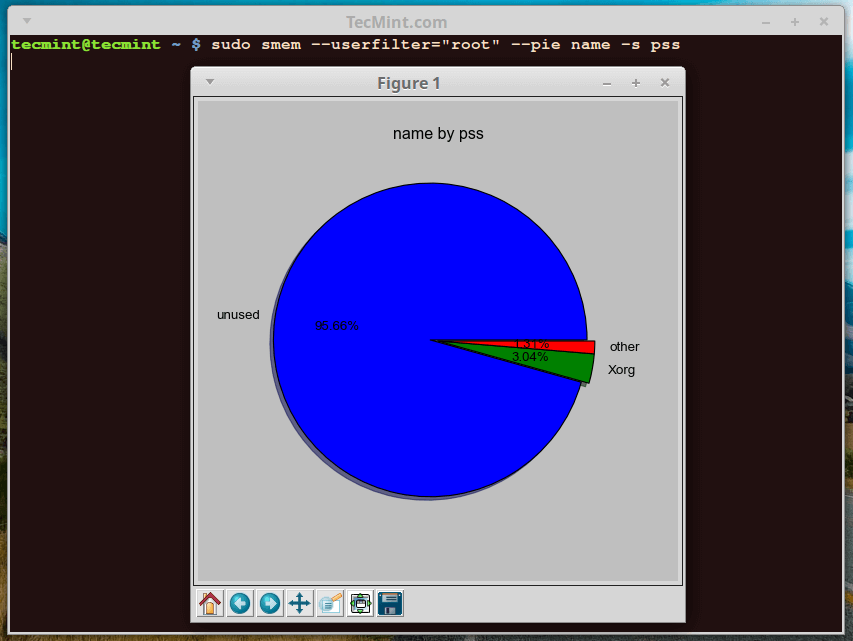
There are many other known fields apart from PSS and RSS used for labeling charts:
To get help, simply type, smem -h or visit the manual entry page.
smem -h
We shall stop here with smem, but to understand it better, use it with many other options that you can find on the man page. You can use the comment section below to express any thoughts or concerns.



Under the installation instructions, change GIMP to SMEM
@Jonathan,
Corrected in the article…
Thank you for pointing that out! We appreciate your feedback.
Why I am getting more than 100%?
$ smem -tur -p User Count Swap USS PSS RSS oracle 142 2.67% 13.33% 25.63% 204.15% --------------------------------------------------- 142 2.67% 13.33% 25.63% 204.15%what is rss and pss ? please elaborate if there is more such Abbrv,
@John
RSS(Resident Set Size) is the amount of memory occupied by a process that is held in main memory (RAM) and PSS(Proportional Set Size) is the amount RAM occupied by a process(which is the private memory of that process plus the proportion of shared memory with one or more other processes).
Hi,
I’m using CentOS release 6.7. I have installed and enabled EPEL repo, But getting the following
Loaded plugins: fastestmirror, security
Setting up Install Process
Loading mirror speeds from cached hostfile
epel/metalink | 12 kB 00:00
* base: mirror.keystealth.org
* epel: s3-mirror-us-west-2.fedoraproject.org
* extras: mirror.keystealth.org
* updates: mirror.keystealth.org
epel | 4.3 kB 00:00
epel/primary_db | 5.8 MB 00:00
No package python-tk available.
Error: Nothing to do
@Ravi,
I think there’s difference in package names, the old CentOS 6.7 uses tkinter package, so install it using yum as shown:
Thanks Ravi. Its working fine now.
Okay, found it. On Centos it’s sudo yum install tkinter.
@Steve,
On which CentOS version you haven’t found python-tk package, on my CentOS 7 I just did
yum install python-tkand it installed successfully.It’s Oracle Linux 7.2 which is basically CentOS. Weird.
Have you tried installing tkinter package, which is same as python-tk, give it a try and let me know..
What is this python-tk package you’re talking about? Can’t find it. Are you talking about tkinter?