In our previous articles, we have covered the basics of ls command and cat command. In this article, we are trying to explore the top command which is one of the most frequently used commands in our daily system administrative jobs.
The top command (table of processes) displays the processor activity of your Linux box and also displays tasks managed by the kernel in real-time. It also shows information about CPU and memory utilization of a list of running processes.
You might also be interested in the following tutorials :
- Htop – An Interactive Process Viewer for Linux
- Iotop – Monitor Linux Disk I/O Activity and Usage Per-Process Basis
- bmon – A Powerful Network Bandwidth Monitoring for Linux
- Find Top 15 Processes by Memory Usage in Linux
1. List All Running Linux Processes
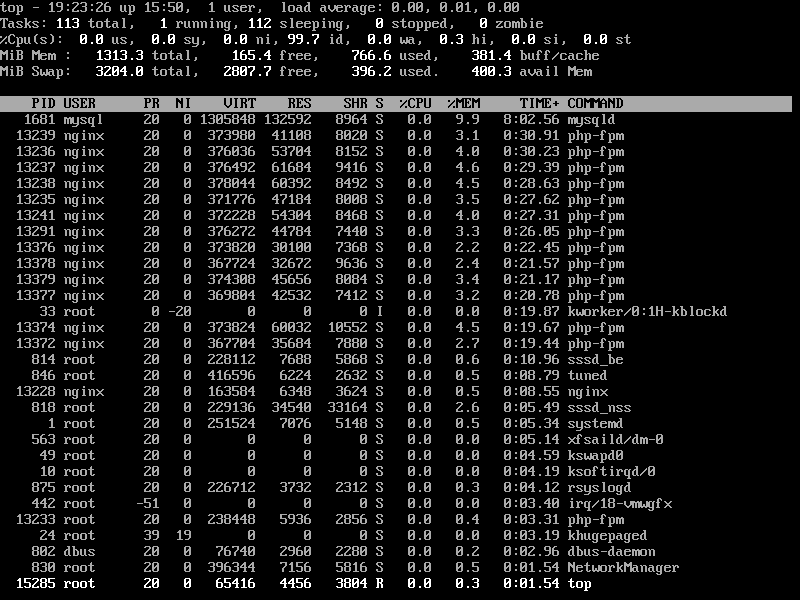
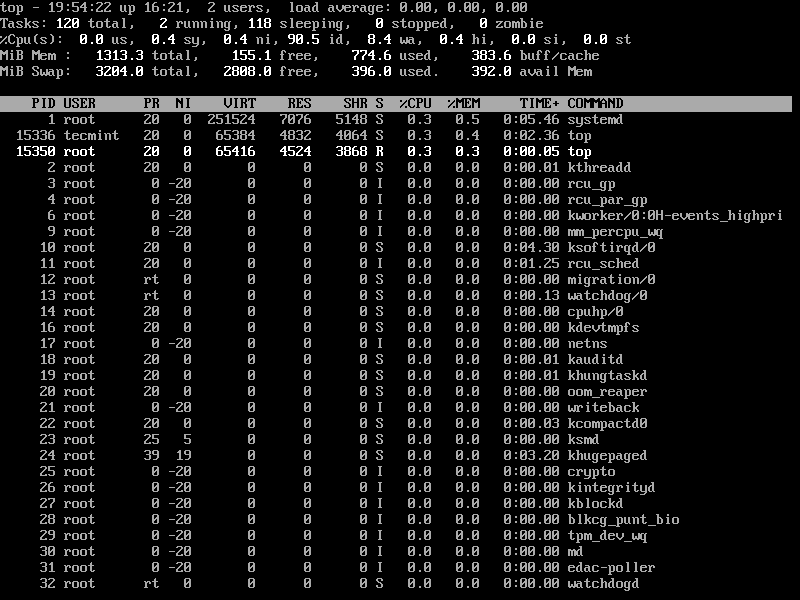
To list all running Linux Processes, simply type top on the command line to get the information of running tasks, memory, cpu, and swap. Press ‘q‘ to quit window.
# top

2. Sort Linux Processes by PID
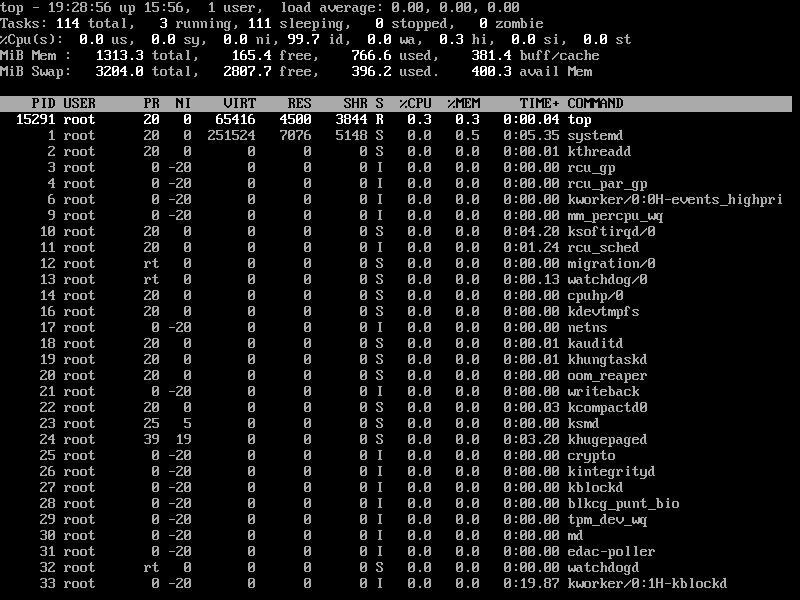
To sort all Linux running processes by Process ID, press M and T keys.
3. Sort Linux Processes by Memory and CPU Usage
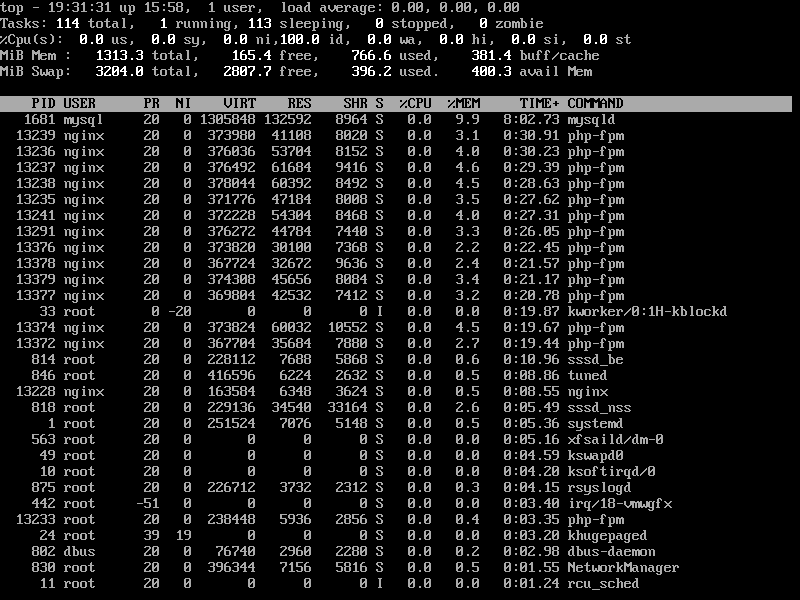
To sort all Linux running processes by Memory usage, press M and P keys.
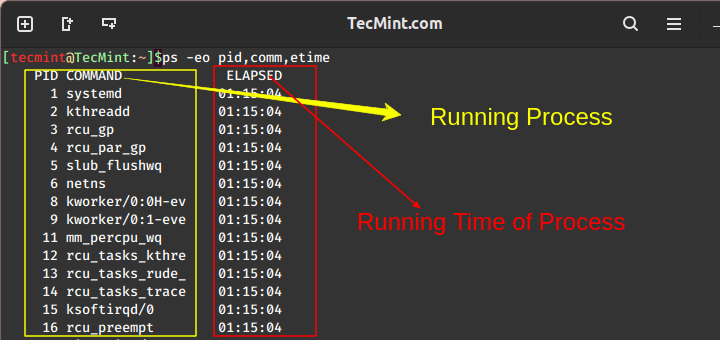
4. Sort Linux Processes by Running Time
To sort all Linux running processes by running time, press M and T keys.
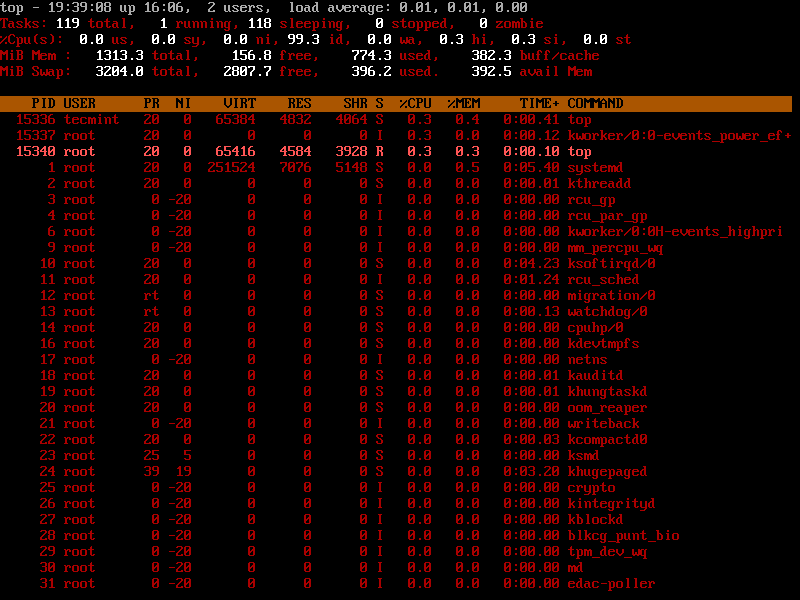
5. Display Linux Processes By Specific User
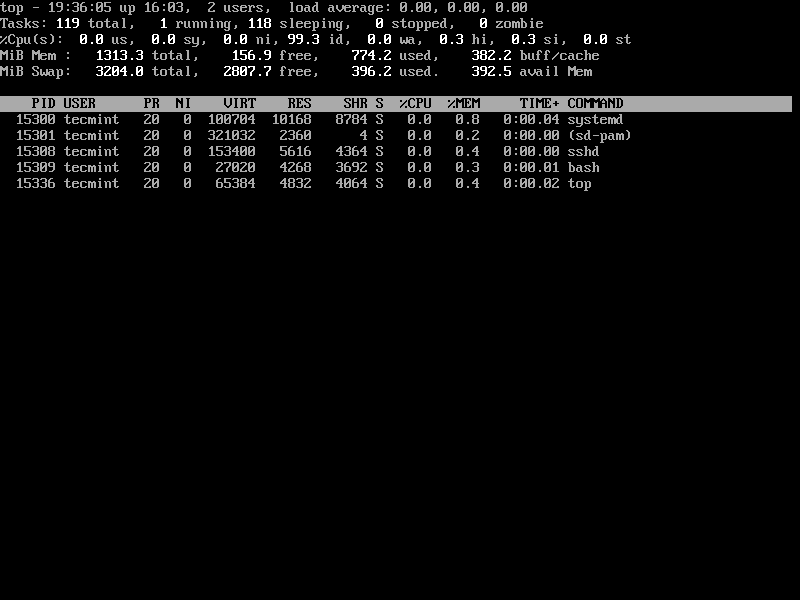
To display all user-specific running processes information, use the -u option will list specific User process details.
# top -u tecmint
6. Highlight Running Process in Top
Press ‘z‘ option will display the running process in color which may help you to identify the running process easily.
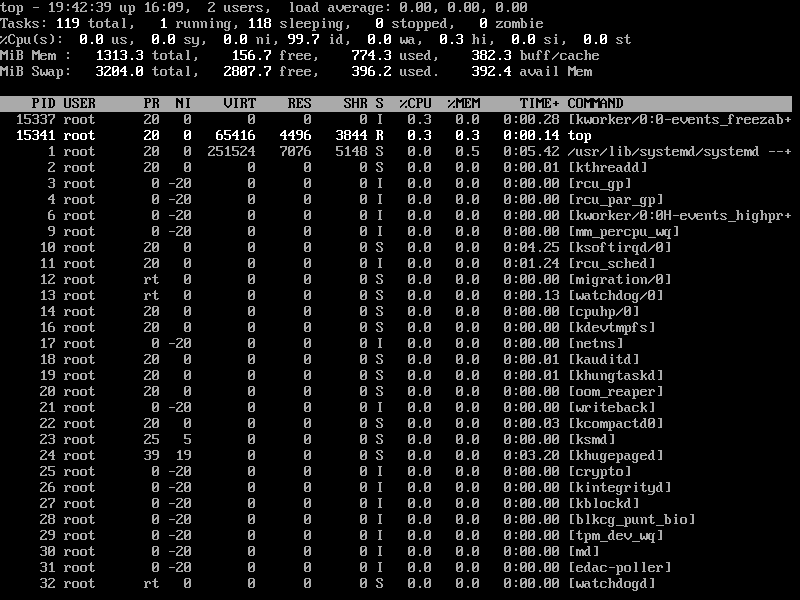
7. List Absolute Path of Running Linux Processes
Press ‘c‘ option in running top command will display the absolute path of the running process.
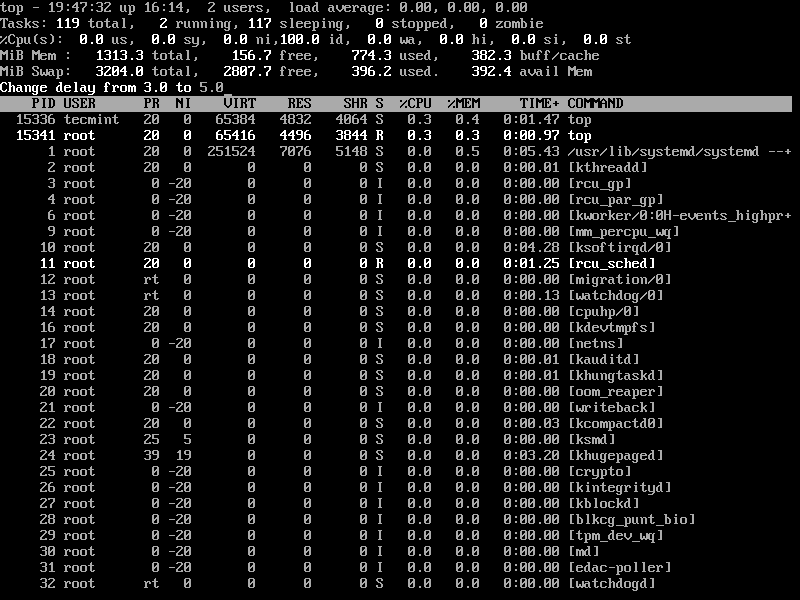
8. Set Refresh Interval for Top Command
By default screen refresh interval is set to 3.0 seconds, the same can be changed by pressing the ‘d‘ option in running the top command to set desired interval time.
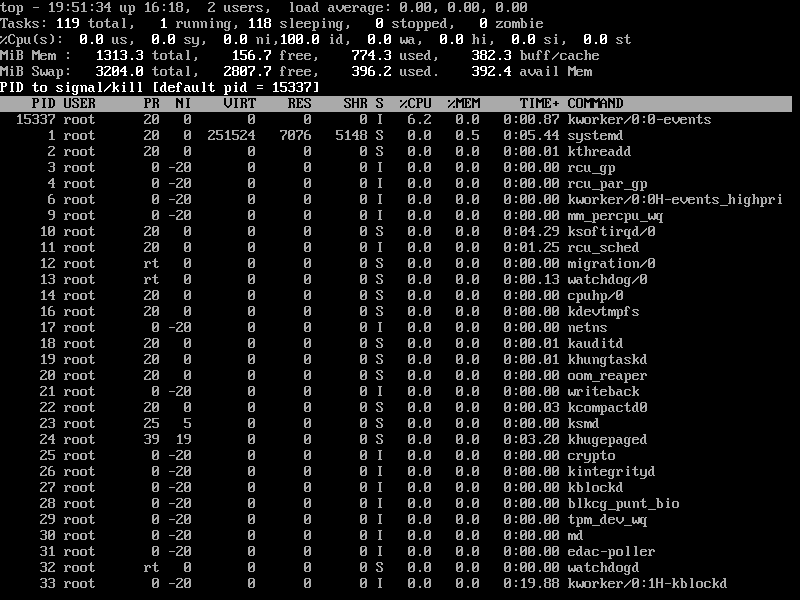
9. Kill Running Linux Process Using Top Command
You can kill a process after finding the PID of the process by pressing the ‘k‘ option in running the top command without closing the top window as shown below.
10. Sort Linux Processes by CPU Utilisation
To sort all running processes by CPU utilization, simply press Shift+P key.
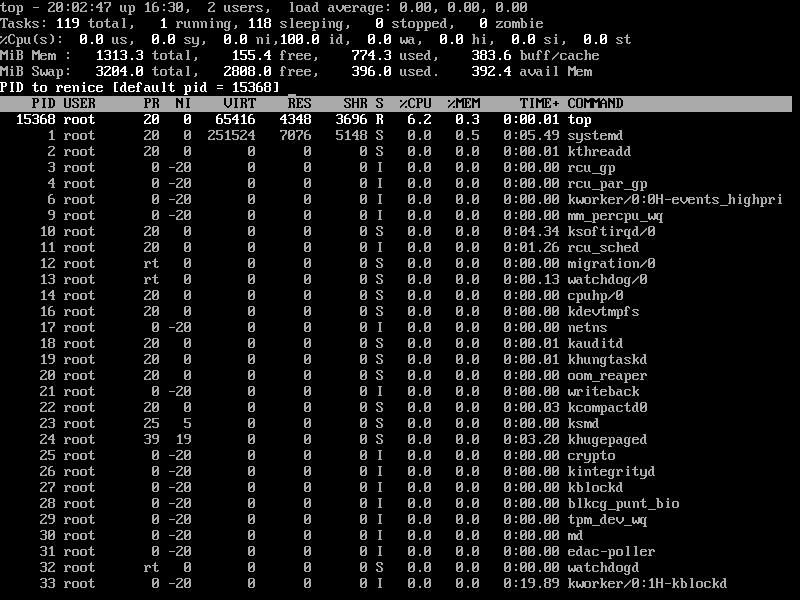
11. Renice a Linux Process
You can use the ‘r‘ option to change the priority of the process also called Renice.
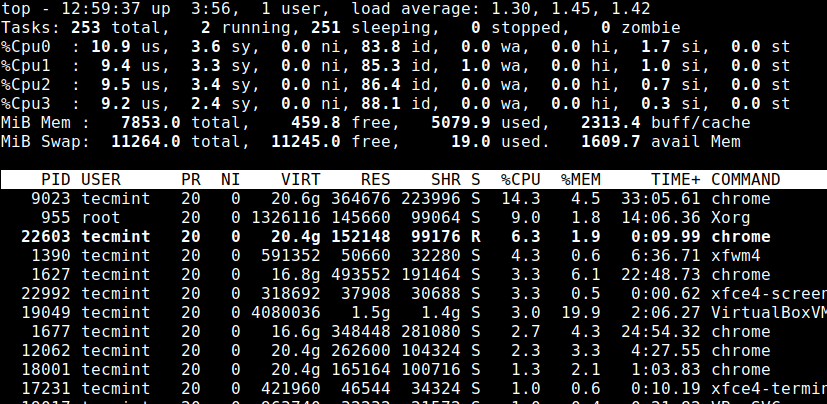
12. Check Linux CPU Cores
To list the load information of your CPU cores, simply press 1 to list the CPU core details.
13. Save Top Command Results in File
To save the running top command results output to a file /root/.toprc use the following command.
# top -n 1 -b > top-output.txt
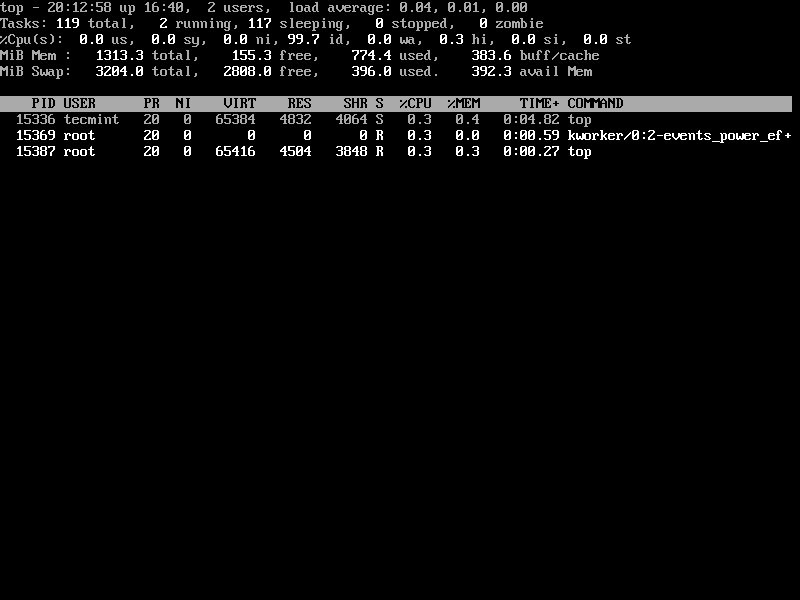
14. List Linux Idle Processes
Press 'i' to get the list of idle/sleeping processes.
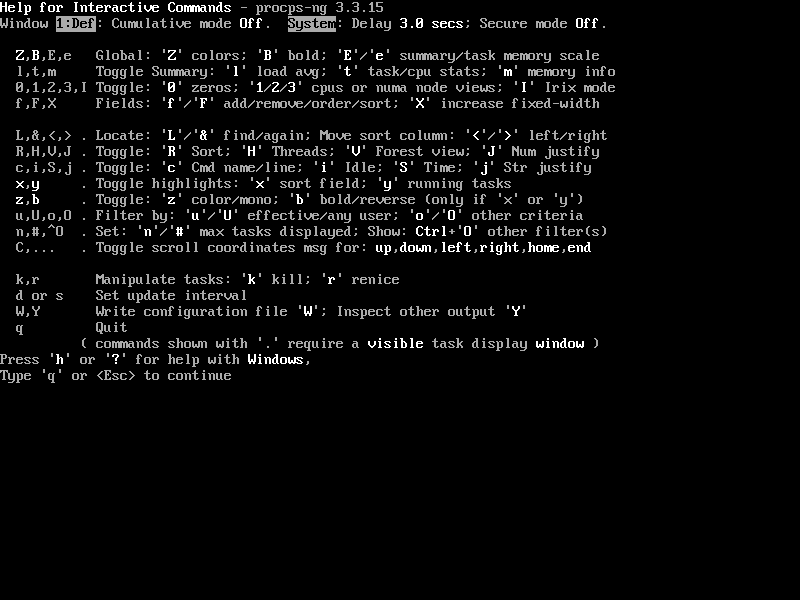
15. Getting Top Command Help
Press the ‘h‘ option to obtain the top command help.
16. Exit Top Command After Specific Repetition
The output of the top command keeps refreshing until you press ‘q‘. With the below command, it will automatically exit after 10 repetitions.
# top -n 10
There is a number of arguments to know more about the top command, you may refer man page of the top command. Please share it if you find this article useful or share your thoughts using our comment box below.


Great article!! Is there any GUI way of visualizing the top command that is output to a file after sort say for CPU utilization?
@Harsha,
Check this article – How to Save Top Command Output to a File
Can you explain use of options in this command.
@Madhav,
The
-noption specifies the maximum number of iterations and-benables batch mode operation, which could be useful for sending output from top to a file.Nice article, but how to search and see specific process memory and CPU utilization?
@Khim,
I think you should read this article Find Top 15 Processes By Memory Usage in Linux
very nice Article…!!!
basically I want this output to a file.. for 10 mins..
top – 13:29:09 up 1 day, 20:30, 1 user, load average: 0.65, 0.70, 0.69
Tasks: 1022 total, 1 running, 1020 sleeping, 0 stopped, 1 zombie
%Cpu0 : 13.0 us, 2.7 sy, 0.0 ni, 84.3 id, 0.0 wa, 0.0 hi, 0.0 si, 0.0 st
%Cpu1 : 49.3 us, 3.6 sy, 0.0 ni, 45.7 id, 0.3 wa, 0.3 hi, 0.0 si, 0.7 st
%Cpu2 : 2.0 us, 2.0 sy, 0.0 ni, 95.4 id, 0.0 wa, 0.3 hi, 0.3 si, 0.0 st
%Cpu3 : 7.6 us, 2.0 sy, 0.0 ni, 90.4 id, 0.0 wa, 0.0 hi, 0.0 si, 0.0 st
%Cpu4 : 1.3 us, 2.3 sy, 0.0 ni, 96.0 id, 0.0 wa, 0.0 hi, 0.3 si, 0.0 st
%Cpu5 : 26.1 us, 2.6 sy, 0.0 ni, 70.3 id, 0.3 wa, 0.3 hi, 0.0 si, 0.3 st
KiB Mem : 41042384 total, 1621820 free, 6024132 used, 33396432 buff/cache
KiB Swap: 21946356 total, 21946308 free, 48 used. 9811332 avail Mem
PID USER PR NI VIRT RES SHR S %CPU %MEM TIME+ COMMAND
34389 root 20 0 967380 57812 8156 S 91.7 0.1 243:41.66 java
4295 oracle 20 0 4517788 497680 9364 S 0.0 1.2 4:15.28 java
Hi All, is there a way to get top output for a given command only listing all CPU info also and write to a file..
@Jai,
Please go through this following article, that will explain how to save top command output to a file in Linux.
How to Save Top Command Output to a File
much usefull and clear explanation of the command with screenshots..also simple and easy to understand
Can someone please help me to gather only the top 20 processes information from the top command into a file after each 60 seconds of interval?
@Victor,
Here is the article, that will list Top 15 Processes by Memory Usage with Top Command.
Excellent Ravi,
Thank you for you information..
Hi Ravi
Point 10 saving top’s output to a file saves it configuration instead.
Please suggest in that,correct it if its wrong.
PFB output.
RCfile for “top with windows” # shameless braggin’
Id:a, Mode_altscr=0, Mode_irixps=0, Delay_time=3.000, Curwin=0
Def fieldscur=AEHIOQTWKNMbcdfgjPlrsuvyzX
winflags=62777, sortindx=15, maxtasks=0
summclr=1, msgsclr=1, headclr=3, taskclr=1
Job fieldscur=ABcefgjlrstuvyzMKNHIWOPQDX
winflags=62777, sortindx=0, maxtasks=0
summclr=6, msgsclr=6, headclr=7, taskclr=6
Mem fieldscur=ANOPQRSTUVbcdefgjlmyzWHIKX
winflags=62777, sortindx=13, maxtasks=0
summclr=5, msgsclr=5, headclr=4, taskclr=5
Usr fieldscur=ABDECGfhijlopqrstuvyzMKNWX
winflags=62777, sortindx=4, maxtasks=0
summclr=3, msgsclr=3, headclr=2, taskclr=3
@Abishek,
Yes its just only saves top configuration, to save the top running output to a file use the following command.
This is very helpful. Is there a guide to definitions of all the top headers? i.e. PR, NI etc.
This was VERY helpful for my OCR Computing Controlled Assesment, thanks!
If server has multiple processor suppose (3) is CPU usage will show 300% in top command or consolidate under 100%, and How can we see individual CPU Usage if server has multiple processors
just hit “1”. It will break out the the various CPUs
Ravi, it’s good collection of examples. Each and every details covered. Want to see more of this kind of work
@Srinivas,
Thanks for finding these example top command useful, more to come stay tuned..
Thank you very much ! Very helpful and useful.
Now I use : top -u myUser
Hello, I was wondering if anyone could help me by evaluating the usefulness of the top command to a technician when using it with ps and kill in order to investigate a system that is misbehaving. Thank you.
@Prince,
I suggest you to read the following articles that shows how to troubleshoot Linux systems when things misbehave….:)
https://www.tecmint.com/audit-network-performance-security-and-troubleshooting-in-linux/
https://www.tecmint.com/linux-system-monitoring-troubleshooting-tools/
Hi Ravi,
Please suggest some good links for L3 level Linux admin troubleshooting info (interview purpose).
keep up the good work.
It seems the duplication occurs when java script is disabled.
I don’t know if it’s just my setup, but, every image in the article body is duplicated (each image is shown twice, the 2nd copy of the image is immediately below the first image
@Smokingmoe,
Its seems your browser issue I think, could you try on different browser and see?
Hi,
How do I specify TOP to only one or two software? for example, I need the information about Hashcat and John to be appear on screen and the rest disappear.
Thank you!
Shndo,
In this case, you should use ps command, go through these articles, you will know how to find specific processes.
https://www.tecmint.com/find-processes-by-memory-usage-top-batch-mode/
https://www.tecmint.com/find-linux-processes-memory-ram-cpu-usage/
Thanks, Ravi,
I’m looking for a live update and continuously save updates to a file. Since the TOP gives me all the processes, it takes a lot of space. I just want something to save the output of two processes continually.
Thanks!
I need top to show only one or two specific softwares activity. Hashcat and John only for example. How do we do that?
Thank you!
Are these commands work on all type of Linux Operating system and What about sudo which is used in VPS having Linux operating system?
Regards.
@Shees,
Top command is the default built-in process monitoring tool in Linux and sudo is used to in VPS to grand root privileges to normal users to execute certain system commands on Linux.
Good documentation !!
Given Above: Press (Shift+W) to save the running top command results under /root/.toprc.
Correct: Press “W” or “Shift+w” to save current configuration in ~/.toprc.
Can anyone say how to extract and write only the timestamp value and its corresponding cpu,memory, and swap value into text
Thank you so much Ravi. I have started working on Unix and this is very very helpful.
@Varsha,
Thanks for finding this article helpful, and good wishes for your Linux path..keep visiting.
Very useful article, thank you!
In the Cpu(s) line what does each field represent and How to know the total CPU Utilization??? is it the summation of all??
Hi Ravi,
It is very usefull options you shared with us. Thanks lot for this
what is recommend if memory utilization is high in the server and server getting very slow.
@Suresh,
Thanks for finding my article useful, regarding Linux memory high utilization issues, you should read this article..
How to Audit Linux Performance and Troubleshoot
what are the command line for these that can be done in terminal , hence alias
Hi Ravi… If we save the top command results in /root/.toprc …. how to view this file next time. what exactly is .toprc … is this a configuration file..
if load average is going very high due to a particular process and i can’t stop the process.in that case what other alternate step i can take?
@Shivam,
You can kill the process by its PID or you can take appropriate steps to troubleshoot why exactly the load is too high for particular process.
It’s quite useful.
@Wchen,
Command to pause the job
kill -s STOP pid number
Command to resume the job
kill -s CONT pid number
Hope this should work.
How to see only the top running process in top command
Its very helpful to me.. Thanks
Hi Ravi;
what’s the command key to temporary pause the big memory job, then how to restore the pause back to run mode?
Hi Ravi,
what is sleeping in top command. and what is its utilization.
regards,
Amit rai
@Amit,
Sleep, means waiting for the process to complete..
Hi Ravi,
Article is very good .
One thing I didn’t see any difference when I tried this Sorting with -O (Uppercase Letter ‘O’
If possible can you please explain a bit more .
Thanks
Thank You !!!!
How do I see detail pid ? such as path of pid
To get Quick understanding : good explaination
Thanks for article. I love to use HTOP.
Hi,
i have req like i need to get Total CPU consmued by all processes is for particular user:
i have used command :
ps -eo pcpu | grep fa1dev |awk ‘BEGIN { printf “Total CPU consmued by all processes is: ” } /^ *[0-9]/ { total_pcpu +=$1 } END { printf total_pcpu }’
output i m getting like:Total CPU consmued by all processes is:
can you please update me command
Nice, good job.
thanks for sharing helping commands, its help all Linux system admin.
Highlight Running Process in Top is not working , is mapping of the color required?.
Thanks
Nithin.
Great explanation, hope you dont mind linking to your website. Thanks.
Very useful blog. Thanks for this.
I am WebSphere Application Server Admin, looking forward to get help from you on linux
like what is swap , zombie, and paging etc.
Hi ravi,
Very useful cmds , it will be very useful if you can describe top cmd output.
ram
Excellent – just what I needed, written in a way I could read what I needed, and act on it right away… Thank You!!!
htop here…
don’t forget ps-aux
Does it support feature like filter such as sort by, renice a process, or such above features ?
No, it does not support.
I hope you are getting my point! :)
I use htop
I tried write the top results to file, but i am not able to read the data, data is not well organised.
Can you mention the above mentioned command while writing the file?
dont do that, use:
Press (Shift+W) to save the running top command results under /root/.toprc.
Thanks.
Nice tutorial.
I m recently joined as system engineer.
Actually I dont know what top command performs, i have followed what you did in the screen. I got same result.
Can you explain what is the purpose of this command?
How do I identify any wrong(process) in the terminal?
Thanks
@AshokKumar – the top command is used to monitor real time running processes in Linux. It is used to identify which processes is utilizing high CPU or memory usage. so you can kill that process with top command as we mentioned above.
Is it similar to Task Manager in case of Window ?
Yes.. task manager–> Processes
There is a typo in “Kill running process with argument ‘d’” . It must be ‘k’
@Victor Ostorga,
Thanks for pointing out, corrected now.