Nginx amplify is a collection of useful tools for extensively monitoring a open source Nginx web server and NGINX Plus. With NGINX Amplify you can monitor performance, keep track of systems running Nginx and enables for practically examining and fixing problems associated with running and scaling web applications.
It can be used to visualize and determine a Nginx web server performance bottlenecks, overloaded servers, or potential DDoS attacks; enhance and optimize Nginx performance with intelligent advice and recommendations.
In addition, it can notify you when something is wrong with the any of your application setup, and it also serves as a web application capacity and performance planner.
The Nginx amplify architecture is built on 3 key components, which are described below:
- NGINX Amplify Backend – the core system component, implemented as a SaaS (Software as a Service). It incorporates scalable metrics collection framework, a database, an analytics engine, and a core API.
- NGINX Amplify Agent – a Python application which should be installed and run on monitored systems. All communications between the agent and the SaaS backend are done securely over SSL/TLS; all traffic is always initiated by the agent.
- NGINX Amplify Web UI – a user interface compatible with all major browsers and it is only accessible only via TLS/SSL.
The web UI displays graphs for Nginx and operating system metrics, allows for the creation of a user-defined dashboard, offers a static analyzer to improve Nginx configuration and an alert system with automated notifications.
Step 1: Install Amplify Agent on Linux System
1. Open your web browser, type the address below and create an account. A link will be sent to your email, use it to verify the email address andlogin to your new account.
https://amplify.nginx.com
2. After that, log into your remote server to be monitored, via SSH and download the nginx amplify agent auto-install script using curl or wget command.
$ wget https://github.com/nginxinc/nginx-amplify-agent/raw/master/packages/install.sh
OR
$ curl -L -O https://github.com/nginxinc/nginx-amplify-agent/raw/master/packages/install.sh
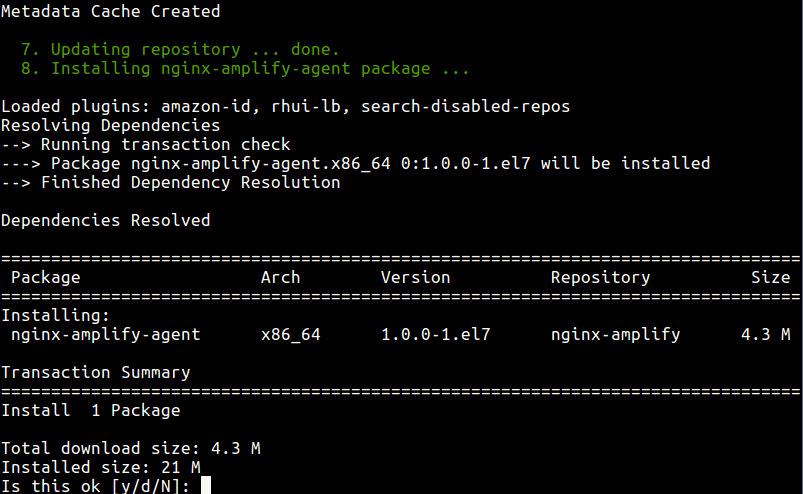
3. Now run the command below with superuser privileges using the sudo command, to install the amplify agent package (the API_KEY will probably be different, unique for every system that you add).
$ sudo API_KEY='e126cf9a5c3b4f89498a4d7e1d7fdccf' sh ./install.sh
Note: You will possibly get an error indicating that sub_status has not been configured, this will be done in the next step.
4. Once the installation is complete, go back to the web UI and after about 1 minute, you will be able to see the new system in the list on the left.
Step 2: Configure stub_status in NGINX
5. Now, you need to setup stub_status configuration to build key Nginx graphs (Nginx Plus users need to configure either the stub_status module or the extended status module).
Create a new configuration file for stub_status under /etc/nginx/conf.d/.
$ sudo vi /etc/nginx/conf.d/sub_status.conf
Then copy and paste the following stub_status configuration in the file.
server {
    listen 127.0.0.1:80;
    server_name 127.0.0.1;
    location /nginx_status {
        stub_status;
        allow 127.0.0.1;
        deny all;
    }
}
Save and close the file.
6. Next, restart Nginx services to activate the stub_status module configuration, as follows.
$ sudo systemctl restart nginx
Step 3: Configure Additional NGINX Metrics for Monitoring
7. In this step, you need to setup additional Nginx metrics to keep a close eye on your applications performance. The agent will gather metrics from active and growing access.log and error.log files, whose locations it automatically detects. And importantly, it should be allowed to read these files.
All you have to do is define a specific log_format as the one below in your main Nginx configuration file, /etc/nginx/nginx.conf.
log_format main_ext '$remote_addr - $remote_user [$time_local] "$request" '
                                '$status $body_bytes_sent "$http_referer" '
                                '"$http_user_agent" "$http_x_forwarded_for" '
                                '"$host" sn="$server_name" ' 'rt=$request_time '
                                'ua="$upstream_addr" us="$upstream_status" '
                                'ut="$upstream_response_time" ul="$upstream_response_length" '
                                'cs=$upstream_cache_status' ;
Then use the above log format when defining your access_log and the error_log log level should be set to warn as shown.
access_log /var/log/nginx/suasell.com/suasell.com_access_log main_ext;
error_log /var/log/nginx/suasell.com/suasell.com_error_log  warn;
8. Now restart Nginx services once more, to effect the latest changes.
$ sudo systemctl restart nginx
Step 4: Monitor Nginx Web Server Via Amplify Agent
9. Finally, you can begin monitoring your Nginx web server from the Amplify Web UI.
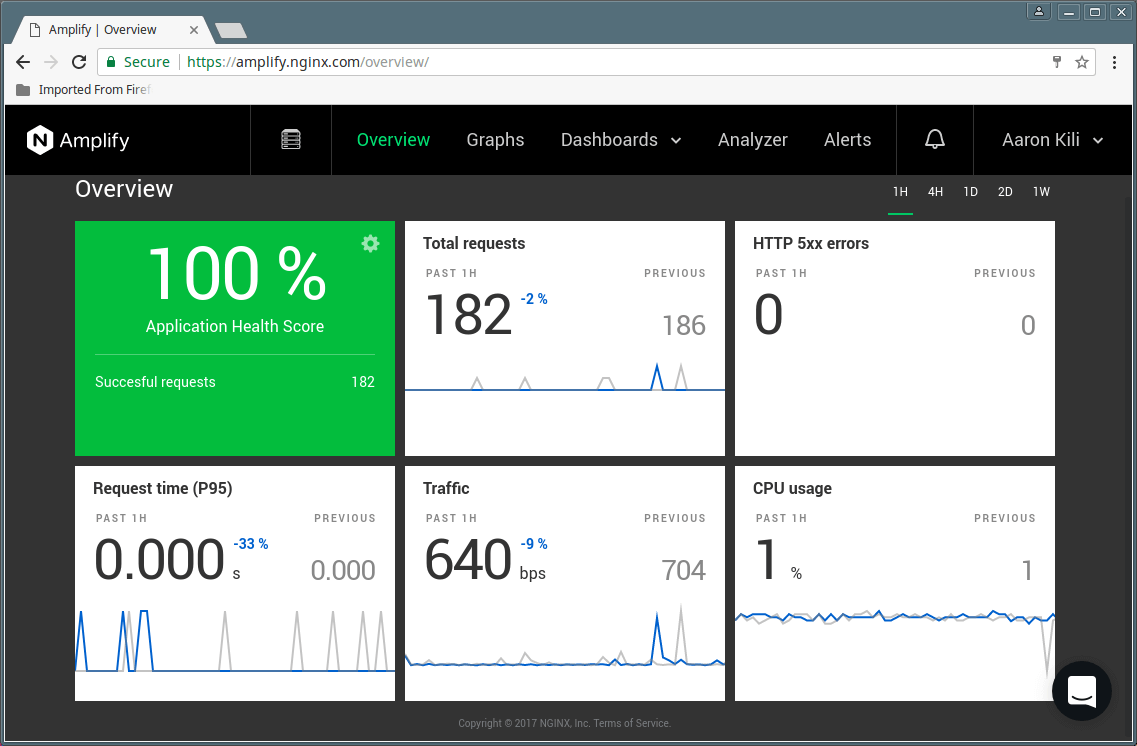
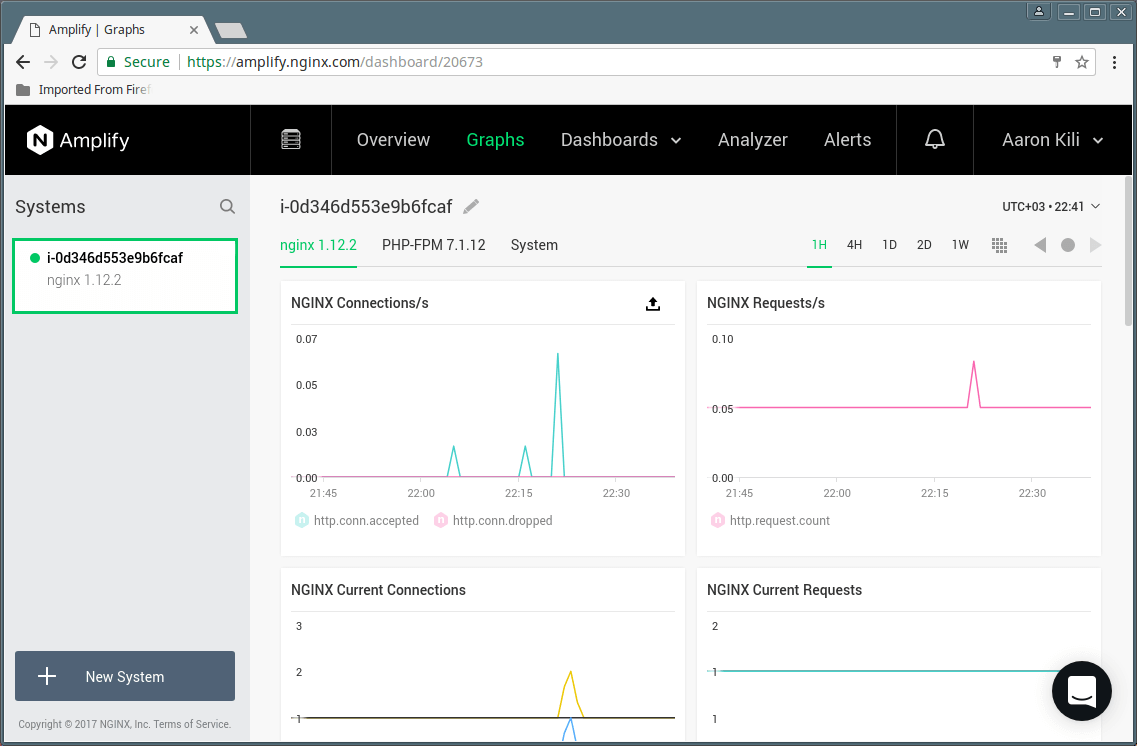
To add a another system to monitor, simply go to Graphs and click on “New System” and follow the steps above.
Nginx Amplify Homepage: https://amplify.nginx.com/signup/
Amplify is a powerful SaaS solution for monitoring your OS, Nginx web server as well as Nginx based applications. It offers a single, unified web UI for keeping an eye on multiple remote systems running Nginx. Use the comment form below to share your thoughts about this tool.