This article is our ongoing series on Linux Auditing, in our last three articles we have explained how to audit Linux systems (CentOS and RHEL), query auditd logs using ausearch and generate reports using aureport utility.
In this article, we will explain how to audit a given process using autrace utility, where we’ll analyze a process by tracing the system calls a process makes.
Read Also: How to Trace Execution of Commands in Shell Script with Shell Tracing
What is autrace?
autrace is a command line utility that runs a program until it exits, just like strace; it adds the audit rules to trace a process and saves the audit information in /var/www/audit/audit.log file. For it to work (i.e before running the selected program), you must first delete all existing audit rules.
The syntax for using autrace is shown below, and it only accepts one option, -r which limits syscalls collected to ones required for assessing resource usage of the process:
# autrace -r program program-args
Attention: In the autrace man page, the syntax as follows, which is actually a documentation mistake. Because using this form, the program you run will assume you’re using one of its internal option thus resulting into an error or performing the default action enabled by the option.
# autrace program -r program-args
If you have any audit rules present, autrace shows the following error.
# autrace /usr/bin/df
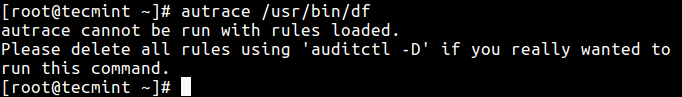
First delete all the auditd rules with the following command.
# auditctl -D
Then proceed to run autrace with your target program. In this example, we are tracing the execution of df command, which shows filesystem usage.
# autrace /usr/bin/df -h
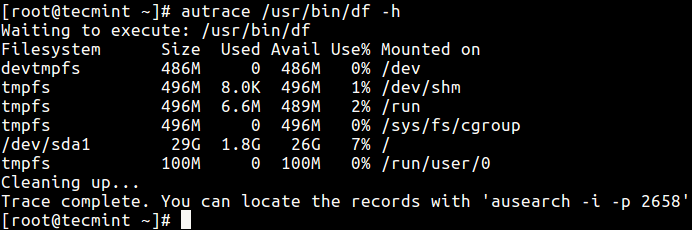
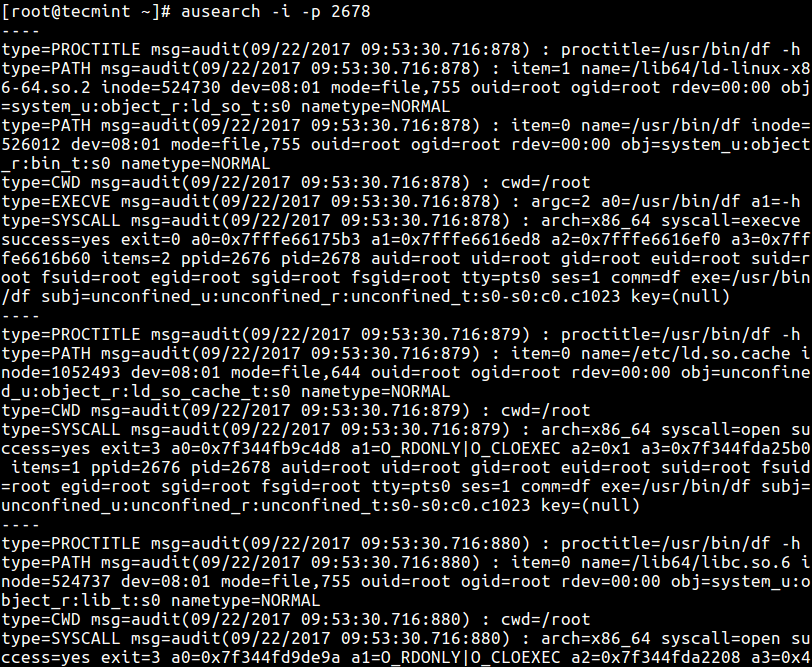
From the screenshot above, you can find all the log entries to do with the trace, from the audit log file using ausearch utility as follows.
# ausearch -i -p 2678
Where the option:
-i– enables interpreting of numeric values into text.-p– passes the process ID to be searched.
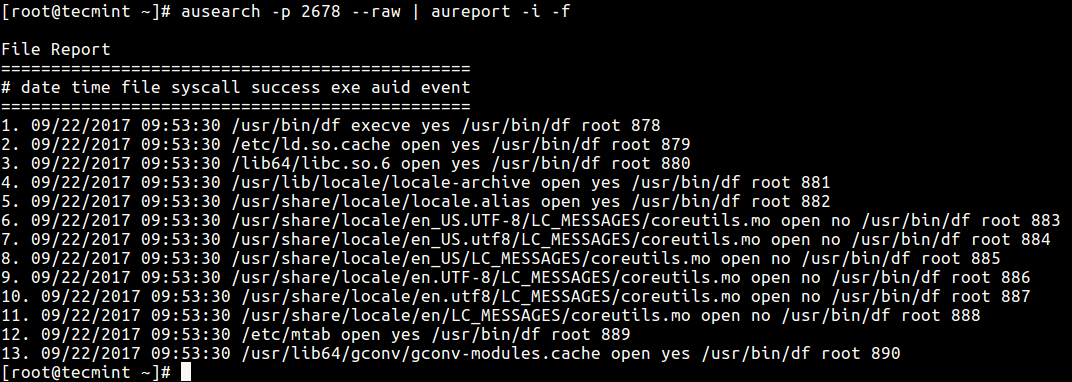
To generate a report about the trace details, you can build a command line of ausearch and aureport like this.
# ausearch -p 2678 --raw | aureport -i -f
Where:
--raw– tells ausearch to deliver raw input to aureport.-f– enables reporting about files and af_unix sockets.-i– allows interpreting of numeric values into text.
And using the command below, we are limiting the syscalls gathered to ones needed for analyzing resource usage of the df process.
# autrace -r /usr/bin/df -h
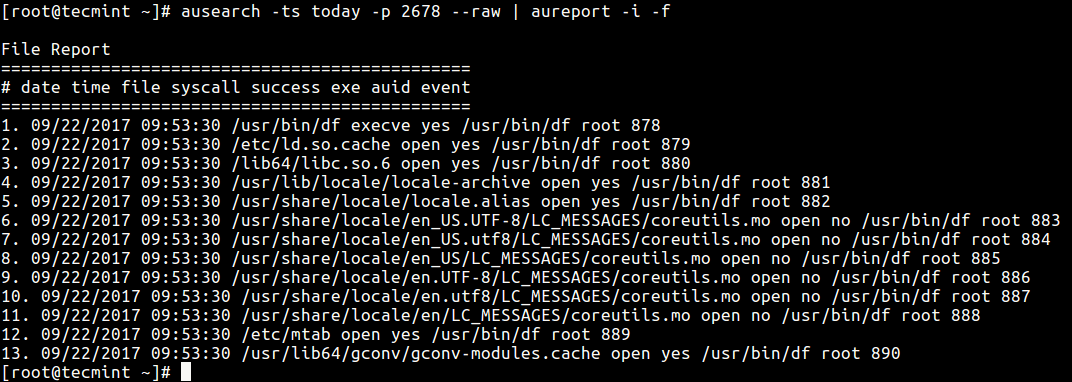
Assuming you have autraced a program for the last one week; meaning there is a lot of information dumped in the audit logs. To produce a report for only today’s records, use the -ts ausearch flag to specify the start date/time for searching:
# ausearch -ts today -p 2678 --raw | aureport -i -f
That’s it! this way you can trace and audit specific Linux process using autrace tool, for more information check man pages.
You can also read out these related, useful guides:
- Sysdig – A Powerful System Monitoring and Troubleshooting Tool for Linux
- BCC – Dynamic Tracing Tools for Linux Performance Monitoring, Networking and More
- 30 Useful ‘ps Command’ Examples for Linux Process Monitoring
- CPUTool – Limit and Control CPU Utilization of Any Process in Linux
- Find Top Running Processes by Highest Memory and CPU Usage in Linux
That’s all for now! You can ask any questions or share thoughts about this article via the comment from below. In the next article, we will describe how to configure PAM (Pluggable Authentication Module) for auditing of TTY input for specified users CentOS/RHEL.