Sysdig is an open-source, cross-platform, powerful and flexible system monitoring and troubleshooting tool for Linux; it also works on Windows and Mac OSX but with limited functionality and can be used for system analysis, inspection and debugging.
Normally, you would employ a mix of various Linux performance monitoring and troubleshooting tools including these ones listed below to perform the Linux monitoring and debugging tasks:
- strace – discover system calls and signals to a process.
- tcpdump – raw network traffic monitoring.
- netstat – network connections monitoring.
- htop – real time process monitoring.
- iftop – real time network bandwidth monitoring.
- lsof – view which files are opened by which process.
However, sysdig integrates what all the above tools and many more, offer in a single and simple program, more so with amazing container support. It enables you to capture, save, filter and examine the real behavior (stream of events) of Linux systems as well as containers.
It comes with a command line interface and a powerful interactive UI (csysdig) which allow you to watch system activity in real time, or perform a trace dump and save for later analysis. You can watch how csysdig works from the below video.
Sysdig Features:
- It is fast, stable and easy-to-use with comprehensively well documented.
- Comes with native support for container technologies, including Docker, LXC.
- It is scriptable in Lua; offers chisels (lightweight Lua scripts) for processing captured system events.
- Supports useful filtering of output.
- Supports system and application tracing.
- It can be integrated with Ansible, Puppet and Logstash.
- Enable sample advanced log analysis.
- It also offers Linux server attack (forensics) analysis features for ethical hackers and lot’s more.
In this article, we will show how to install sysdig on a Linux system, and use it with basic examples of system analysis, monitoring and troubleshooting.
How To Install Sysdig in Linux
Installing sysdig package is as easy as running the command below, which will check all the requirements; if every thing is in place, it will download and install the package from the Draios APT/YUM repository.
# curl -s https://s3.amazonaws.com/download.draios.com/stable/install-sysdig | bash
OR
$ curl -s https://s3.amazonaws.com/download.draios.com/stable/install-sysdig | sudo bash
After installing it, you need to run sysdig as root because it requires access to critical areas such as /proc file system, /dev/sysdig* devices and needs to auto-load the sysdig-probe kernel module (in case it is not); otherwise use the sudo command.
The most basic example is running it without any arguments, this will enable you to view your Linux system stream of events updated in real-time:
$ sudo sysdig
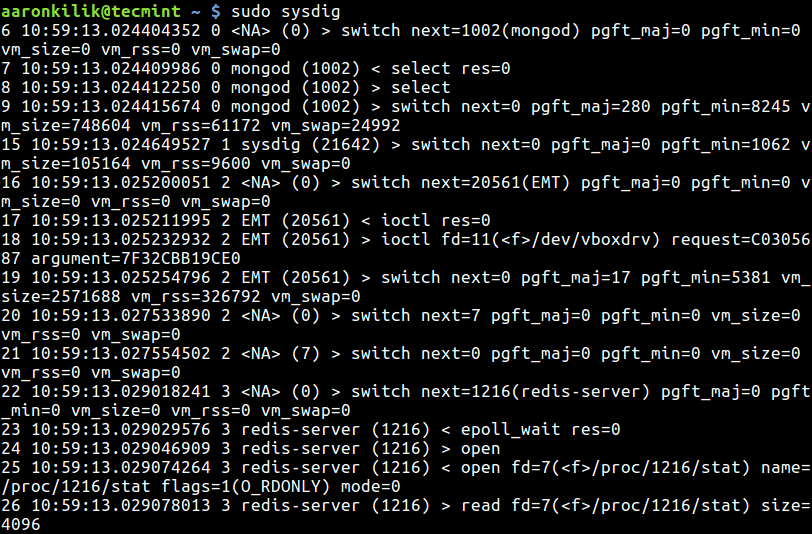
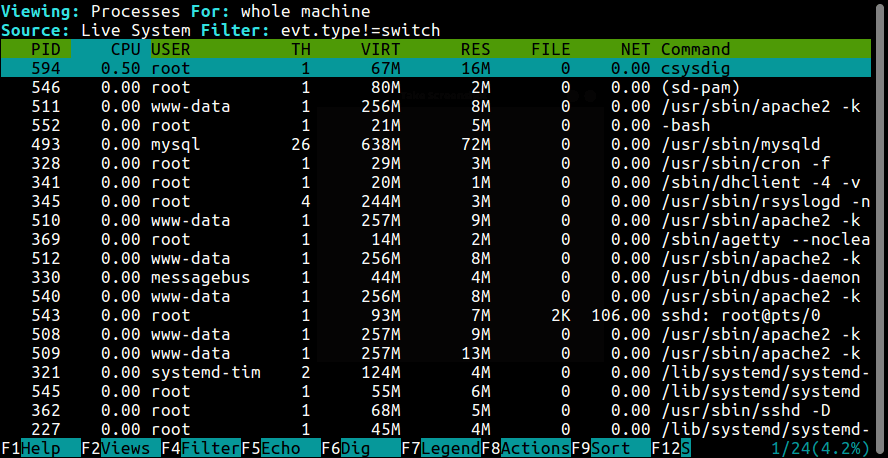
The above output (raw data) does not perhaps make a lot of sense to you, for a more useful output run csysdig:
$ sudo csysdig
Note: To get the real feel of this tool, you need to use sysdig which produces raw data as we saw before, from a running Linux system: this calls for you to understand how to use filters and chisels.
But if you need a painless means of using sysdig – continue with csysdig.
Understanding Sysdig Chisels and Filters
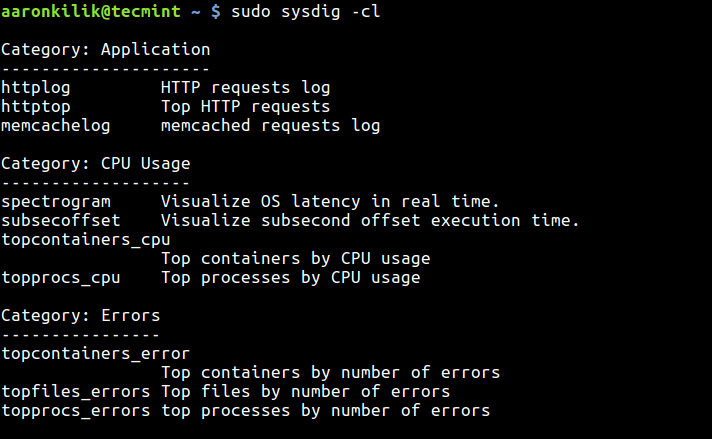
Sysdig chisels are minimal Lua scripts for examining the sysdig event stream to carry out useful system troubleshooting actions and more. The command below will help you view all available chisels:
$ sudo sysdig -cl
The screen shot shows a sample list of chisels under different categories.
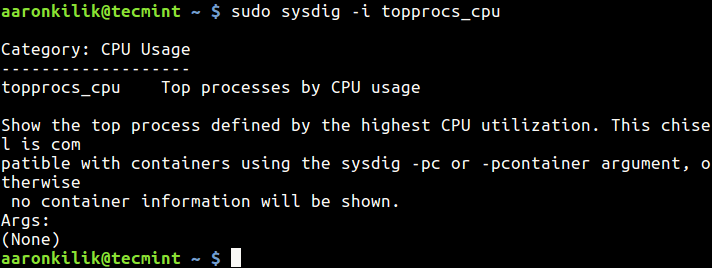
If you want to find out more information about a particular chisel, use the -i flag:
$ sudo sysdig -i topprocs_cpu
Sysdig filters add more power to the kind of output you can obtain from event streams, they allow you to customize the output. You should specify them at the end of a command line.
A straightforward and commonest filter is a basic “class.field=value” check, you can also combine chisels with filters for even more powerful customizations.
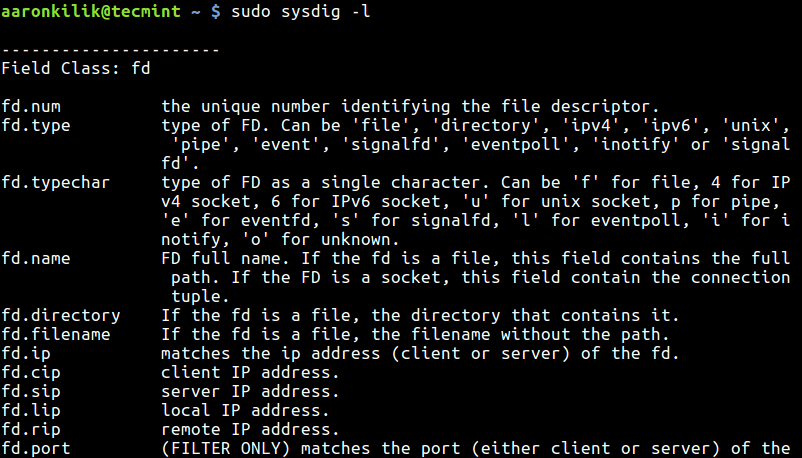
To view a list of available field classes, fields and their descriptions, type:
$ sudo sysdig -l
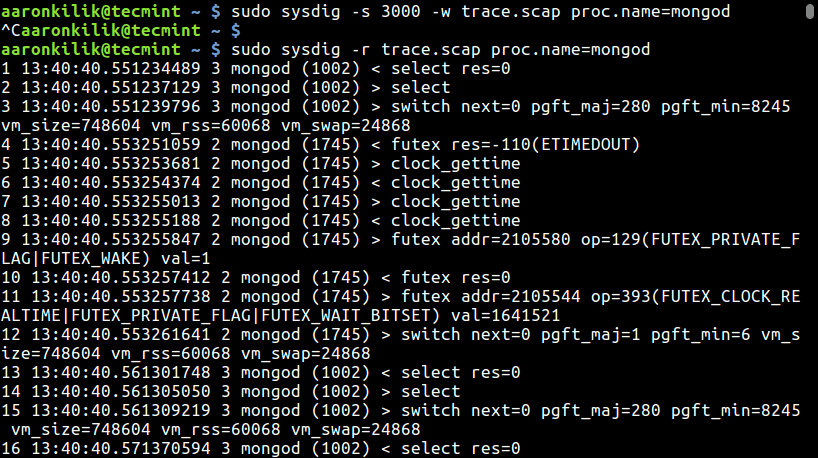
Creating Linux System Trace File
To dump sysdig output in a file for later analysis, use the -w flag like this.
You can read the trace dump file using the -r flag:
$ sudo sysdig -r trace.scap
The -s option is used to specify the amount of bytes of data to be captured for each system event. In this example, we are filtering events for the mongod process.
$ sudo sysdig -s 3000 -w trace.scap
$ sudo sysdig -r trace.scap proc.name=mongod
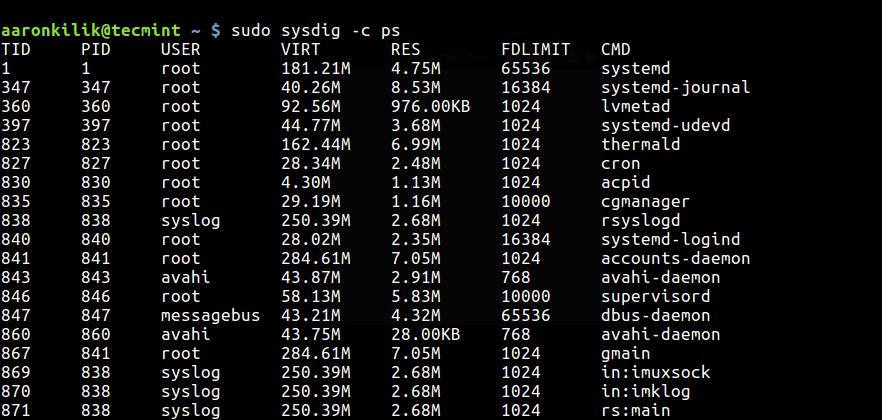
Monitoring Linux Processes
To list system processes, type:
$ sudo sysdig -c ps
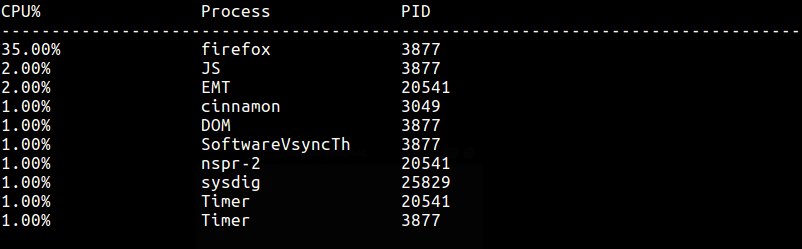
Monitor Processes by CPU Usage
To watch top processes by CPU usage percentage, run this command:
$ sudo sysdig -c topprocs_cpu
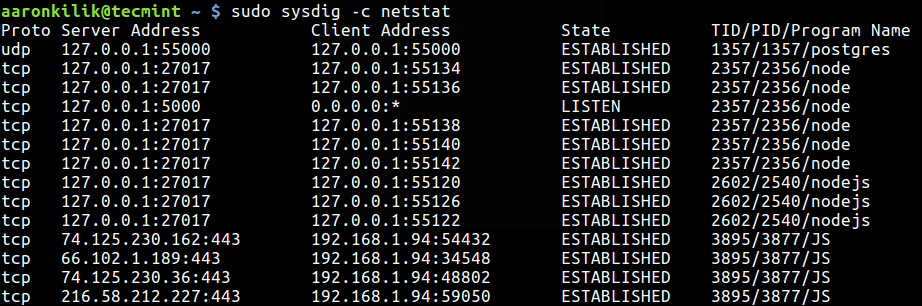
Monitoring Network Connections and I/O
To view system network connections, run:
$ sudo sysdig -c netstat
The following command will help you list top network connections by total bytes:
$ sudo sysdig -c topconns
Next, you can also list top processes by network I/O as follows:
$ sudo sysdig -c topprocs_net
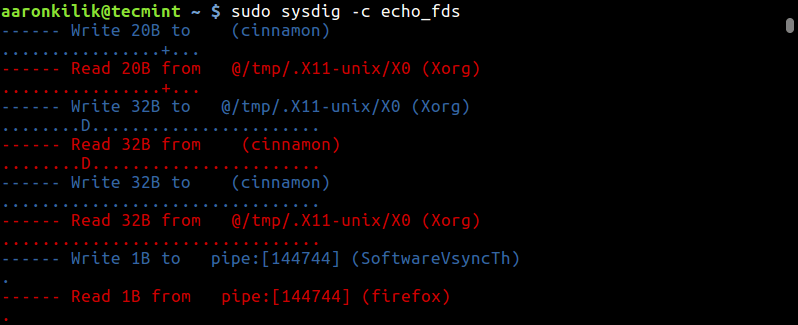
Monitoring System File I/O
You can output the data read and written by processes on the system as below:
$ sudo sysdig -c echo_fds
To list top processes by (read + write) disk bytes, use:
$ sudo sysdig -c topprocs_file
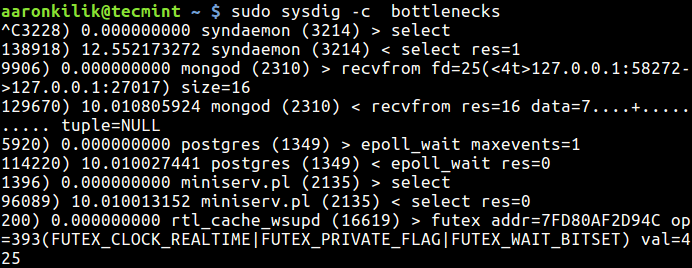
Troubleshooting a Linux System Performance
To keep an eye on system bottlenecks (slow system calls), execute this command:
$ sudo sysdig -c bottlenecks
Track Execution Time of a Process
To track the execution time of a process, you can run this command and dump the trace in a file:
$ sudo sysdig -w extime.scap -c proc_exec_time
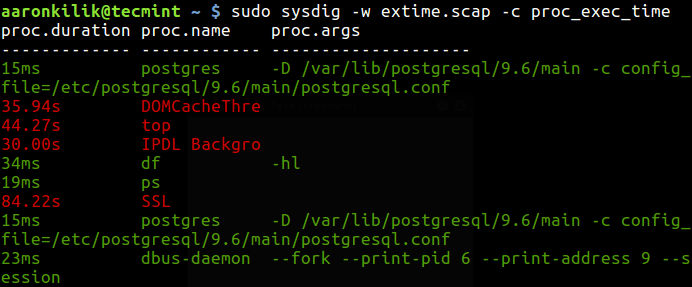
Then use a filter to zero down on details of a particular process (postgres in this example) as follows:
$ sudo sysdig -r extime.scap proc.name=postgres
Discover Slow Network I/0
This simple command will help you detect slow network I/0:
$ sudo sysdig -c netlower
Watching Log File Entries
The command below helps you display every message written to syslog, if you are interested in log entries for a specific process, create a trace dump and filter it out accordingly as shown before:
$ sudo sysdig -c spy_syslog
You can print any data written by any process to a log file as follows:
$ sudo sysdig -c spy_logs
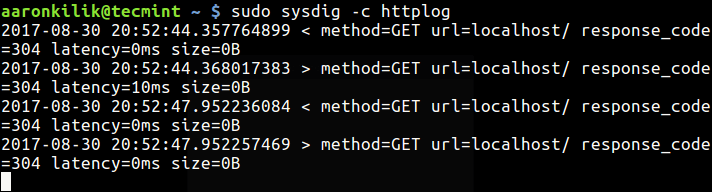
Monitoring HTTP Server Requests
If you have a HTTP server such as Apache or Nginx running on our system, look through the server’s requests log with this command:
$ sudo sysdig -c httplog
$ sudo sysdig -c httptop   [Print Top HTTP Requests]
Display Login Shells and Interactive User Activity
The command below will enable you view all the login shell IDs:
$ sudo sysdig -c list_login_shells
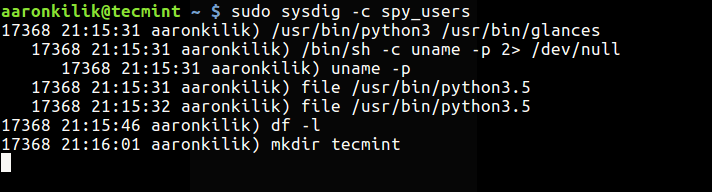
Last but not least, you can show interactive activity of system users like so:
$ sudo sysdig -c spy_users
For more usage information and examples, read the sysdig and csysdig man pages:
$ man sysdig
$ man csysdig
Reference: https://www.sysdig.org/
Also check these useful Linux performance monitoring tools:
- BCC – Dynamic Tracing Tools for Linux Performance Monitoring, Networking and More
- pyDash – A Web Based Linux Performance Monitoring Tool
- Perf- A Performance Monitoring and Analysis Tool for Linux
- Collectl: An Advanced All-in-One Performance Monitoring Tool for Linux
- Netdata – A Real-Time Performance Monitoring Tool for Linux Systems
Conclusion
Sysdig brings together functionalities from numerous command line tools into one remarkable interface, thus allowing you to dig deep into your Linux system events to gather data, save for later analysis and it offers incredible container support.
To ask any questions or share any thoughts about this tool, use the feedback form below.


Thanks a lot Aaron for this very well written guide to Sysdig.
Awesome!!!
@Mauricio
Welcome, many thanks for the kind words of appreciation.