Netdata is a free open source, simple yet powerful, and effective real-time system performance monitoring tool for Linux, FreeBSD and MacOS. It supports various plugins for monitoring general server status, applications, web services such as Apache or Nginx HTTP server and so much more.
Read Also: How to Monitor Nginx Performance Using Netdata on CentOS 7
In this article, we will explain how to monitor Apache HTTP server performance using Netdata performance monitoring tool on a CentOS 7 or RHEL 7 distribution. At the end of this article, you will be able to watch visualizations of requests, bandwidth, workers, and other Apache server metrics.
Requirements:
- A CentOS 7 Server or RHEL 7 Server with Minimal Install.
- Apache HTTP server installation with mod_status module enabled.
Step 1: Install Apache on CentOS 7
1. First start by installing Apache HTTP server from the default software repositories using the YUM package manager.
# yum install httpd
2. After you have installed Apache web server, start it for the first time, check if it is up and running, and enable it to start automatically at system boot using following commands.
# systemctl start httpd
# systemctl enable httpd
# systemctl status httpd
3. If you are running a firewall for example firewalld, you need to open the ports 80 and 443 to allow web traffic to Apache via HTTP and HTTPS respectively, using the commands below.
# firewall-cmd --zone=public --permanent --add-port=80/tcp
# firewall-cmd --zone=public --permanent --add-port=443/tcp
# firewall-cmd --reload
Step 2: Enable Mod_Status Module in Apache
4. In this step, you need to enable and configure mod_status module in Apache, this is required by Netdata for gathering server status information and statistics.
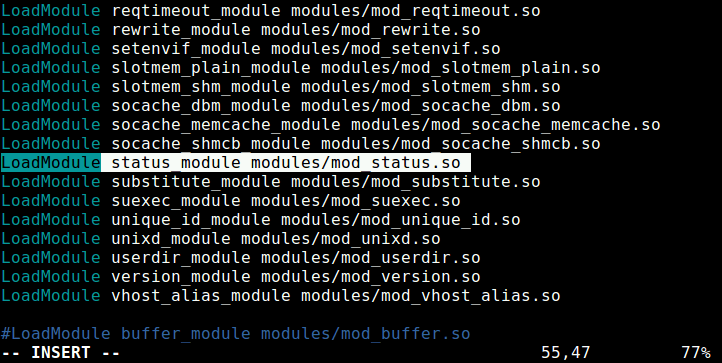
Open the file /etc/httpd/conf.modules.d/00-base.conf file using your favorite editor.
# vim /etc/httpd/conf.modules.d/00-base.conf
And ensure that the line below is uncommented to enable mod_status module, as shown in the screenshot.
5. Once you’ve enabled mod_status, next you need to create a server-status.conf configuration file for the Apache server status page.
# vim /etc/httpd/conf.d/server-status.conf
Add the following configuration inside the file.
<Location "/server-status">
    SetHandler server-status
    #Require host localhost           #uncomment to only allow requests from localhost
</Location>
Save the file and close. Then restart the Apache HTTPD service.
# systemctl restart httpd
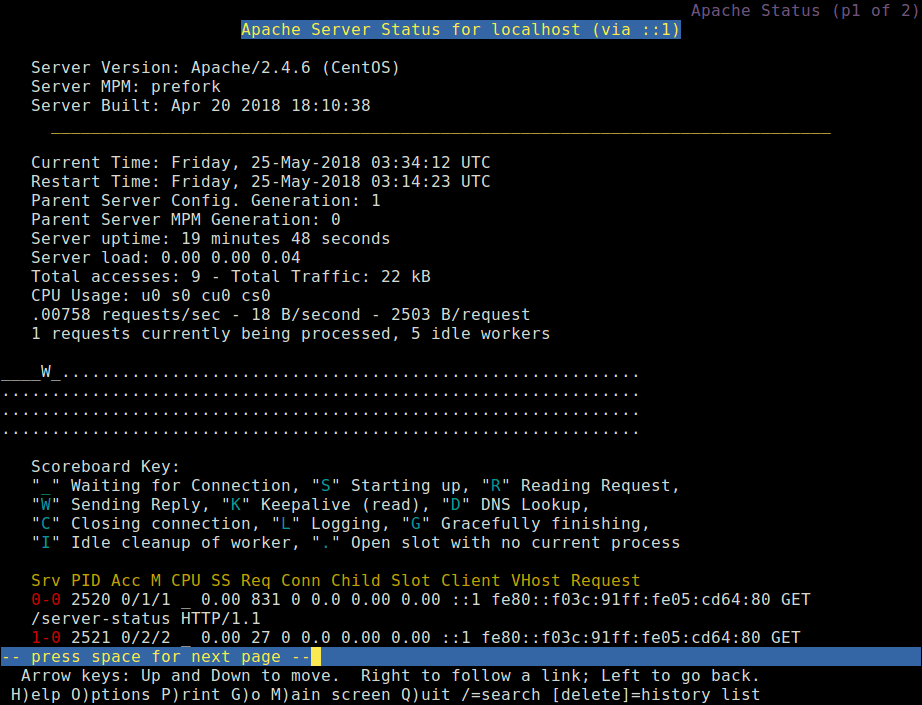
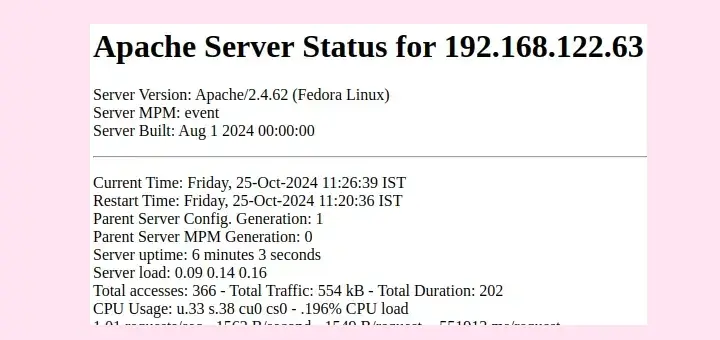
6. Next, you need to verify that the Apache server status and statistics page is working well by using a command-line web browser such as lynx as shown.
# yum install lynx
# lynx http://localhost/server-status
Step 3: Install Netdata on CentOS 7
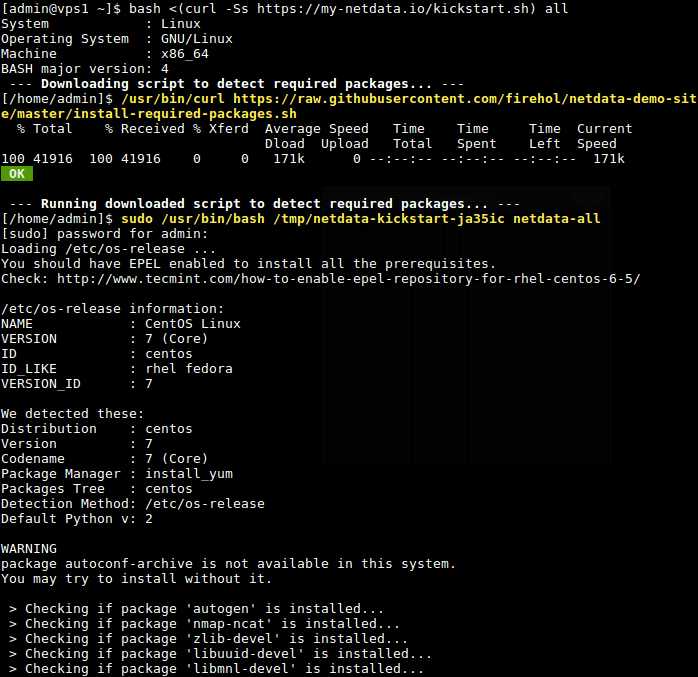
7. Fortunately, there is a kickstarter shell script for painlessly installing netdata from its github repository. This one-liner script downloads a second script which checks your Linux distribution and installs the required system packages for building netdata, then downloads the latest netdata source tree; builds and installs it on your server.
You can start the kickstarter script as shown, the all flag allows for installing required packages for all netdata plugins including the ones for Apache HTTP server.
# bash <(curl -Ss https://my-netdata.io/kickstart.sh) all
Note that if your not administering your system as root, you will be prompted to enter your user password for sudo command, and you will also be asked to confirm a number of functions by pressing [Enter].
8. Once the script has completed building and installing netdata, it will automatically start the netdata service via systemd service manager and enables it to start at system boot.
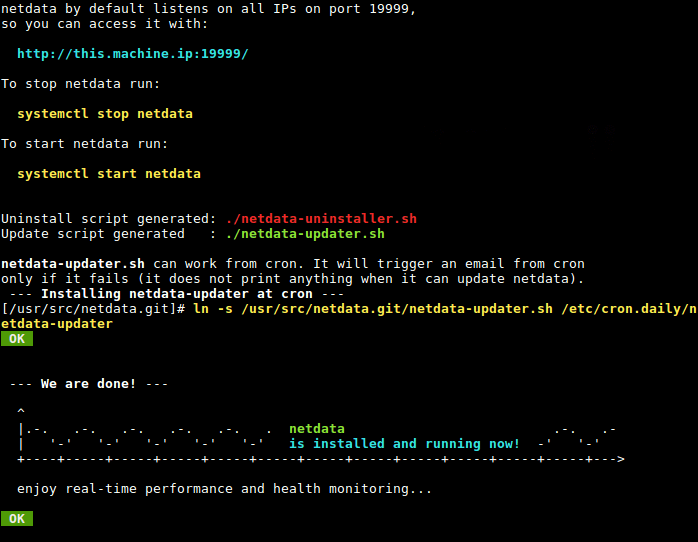
By default, netdata listens on port 19999, you will access the web UI using this port. So, open port 19999 in the firewall to access the netdata web UI.
# firewall-cmd --permanent --add-port=19999/tcp
# firewall-cmd --reload
Step 4: Configure Netdata to Monitor Apache Performance
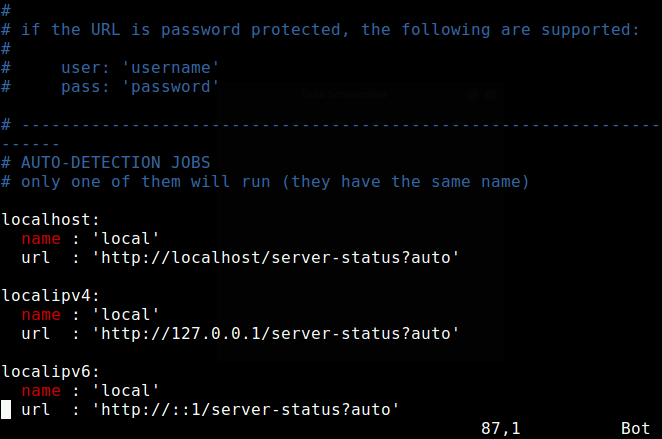
9. The netdata configuration for Apache plugin is /etc/netdata/python.d/apache.conf, this file is written in YaML format, you can open it using your favorite editor.
# vim /etc/netdata/python.d/apache.conf
The default configuration is just enough to get you started with monitoring your Apache HTTP server.
However, if you have read the documentation, and made any changes to it, restart the netdata service to effect the changes.
# systemctl restart netdata
Step 5: Monitor Apache Performance Using Netdata
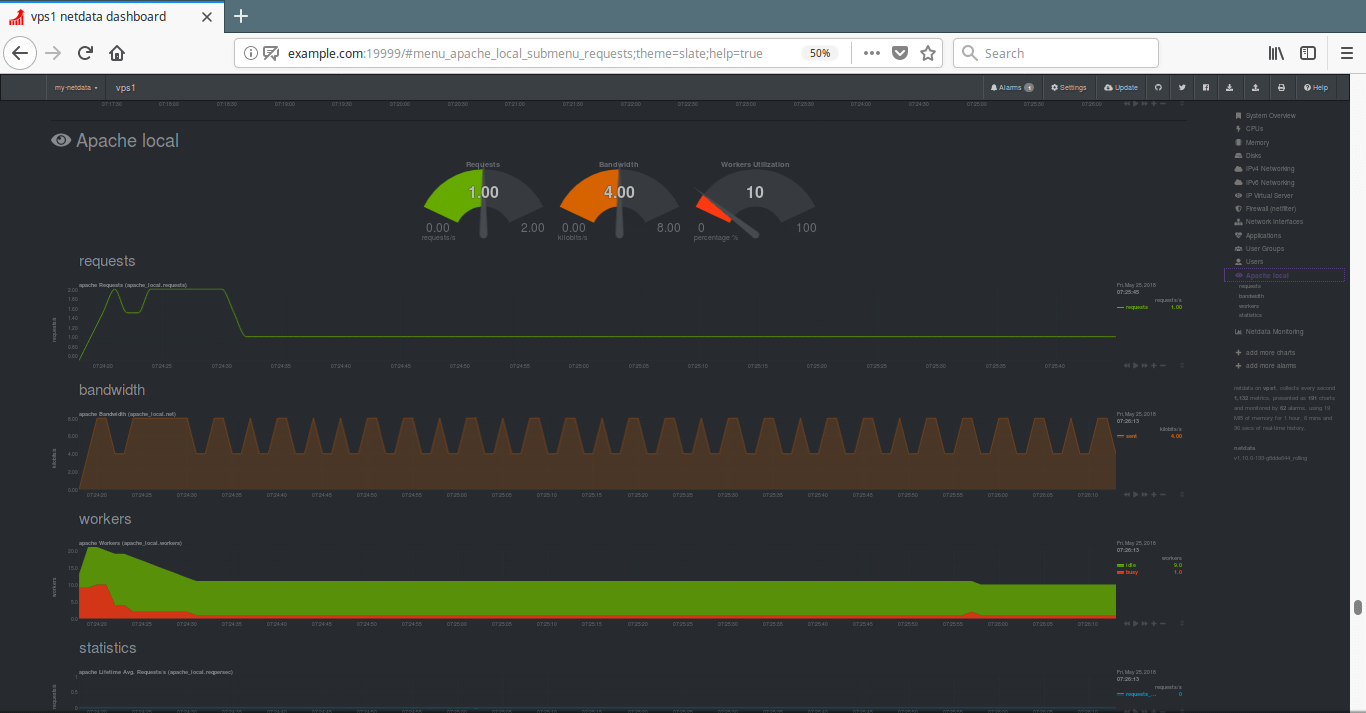
10. Next, open a web browser and use the following URL to access the netdata web UI.
http://domain_name:19999
OR
http://SERVER_IP:19999
From the netdata dashboard, search for “Apache local” on the right hand side list of plugins, and click on it to start monitoring your Apache server. You will be able to watch visualizations of requests, bandwidth, workers, and other server statistics, as shown in the following screenshot.
Netdata Github repository: https://github.com/firehol/netdata
That’s all! In this article, we’ve explained how to monitor Apache performance using Netdata on CentOS 7. If you have any questions or additional thoughts to share, please reach us via the comment form below.


Thank you for article!
I would appreciate your help if you describe how to install Netdata+ Apache on Debian.
Nice guide man!
Would you be interested in updating this guide at some point where this is placed behind apache/nginx? preferably with https and authentication ^^
@Stephen
Okay, great probably behind Nginx, because it is a high-performance and more efficient reverse proxy server, to me and easy to configure with HTTPS and basic authentication. Thanks for the feedback.