Glances is a free open source, modern, cross-platform, real-time top and htop-like monitoring tool with advanced features. It can run in different modes: as a standalone, in client/server mode and in web server mode.
InfluxDB is an open source and scalable time series database for metrics, events, and real-time analytics.
Grafana is an open source, feature rich, powerful, elegant and highly-extensible, cross-platform tool for monitoring and metric analytics, with beautiful and customizable dashboards. It is a de facto software for data analytics.
In this article, we will explain how to install and configure Glances, InfluxDB and Grafana to monitor performance of a CentOS 7 server.
Step 1: Install Glances in CentOS 7
1. First start by installing latest stable version of glances (v2.11.1) using PIP. If you don’t have pip, install it as follows, including Python-headers required for installing psutil.
# yum install python-pip python-devel
2. Once you have PIP and the Python-headers, run the following command to install the latest stable version of glances and verify the version.
# pip install glances
# glances -V

Glances v2.11.1 with psutil v5.4.7
Alternatively, if you already have glances installed, you can upgrade it to the latest version using following command.
# pip install --upgrade glances
3. Now you need to start glances via systemd so that it runs as a service. Create a new unit by creating a file called glances.service in /etc/systemd/system/.
# vim /etc/systemd/system/glances.service
Copy and paste the following configuration in the file glances.service. The --config specifies the config file, --export-influxdb option tells glances to export stats to an InfluxDB server and the --disable-ip option disables the IP module.
[Unit]
Description=Glances
After=network.target influxd.service

[Service]
ExecStart=/usr/bin/glances --config /home/admin/.config/glances/glances.conf --quiet --export-influxdb --disable-ip
Restart=on-failure
RestartSec=30s
TimeoutSec=30s

[Install]
WantedBy=multi-user.target
Save the file and close it.
4. Then reload systemd manager configuration, start the glances service, view its status, and enable it to auto-start at boot time.
# systemctl daemon-reload
# systemctl start glances.service
# systemctl status glances.service
# systemctl enable glances.service
5. Next, you need to download the glances configuration file provided by the developer using wget command as shown.
# mkdir ~/.config/glances/
# wget https://raw.githubusercontent.com/nicolargo/glances/master/conf/glances.conf -P ~/.config/glances/
6. In order to export Glances stats to an InfluxDB database, you need the Python InfluxdDB lib, which you can install it using pip command.
# sudo pip install influxdb
Step 2: Install InfluxDB in CentOS 7
7. Next, you need to add the InfluxDB Yum repository to install latest vesrion of InfluxDB package as shown.
# cat <<EOF | sudo tee /etc/yum.repos.d/influxdb.repo
[influxdb]
name = InfluxDB Repository - RHEL \$releasever
baseurl = https://repos.influxdata.com/rhel/\$releasever/\$basearch/stable
enabled = 1
gpgcheck = 1
gpgkey = https://repos.influxdata.com/influxdb.key
EOF
8. After adding the repository to the YUM configuration, install the InfluxDB package by running.
# yum install influxdb
9. Next, start the InfluxDB service via systemd, confirm that it is running by viewing its status and enable it to auto-start at system boot.
# systemctl start influxdb
# systemctl status influxdb
# systemctl enable influxdb
10. By default, InfluxDB uses TCP port 8086 for client-server communication over InfluxDB’s HTTP API, you need to open this port in your firewall using the firewall-cmd.
# firewall-cmd --add-port=8086/tcp --permanent
# firewall-cmd --reload
11. Next, you need to create a database in InfluxDB for storing data from glances. The influx command which is included in the InfluxDB packages is the simplest way to interact with the database. So execute influx to start the CLI and automatically connect to the local InfluxDB instance.
# influx
Run the following commands to create a database called glances and view available databases.
Connected to http://localhost:8086 version 1.6.2
InfluxDB shell version: 1.6.2
> CREATE DATABASE glances
> SHOW DATABASES
name: databases
name
----
_internal
glances
>
To exit the InfluxQL shell, type exit and hit Enter.
Step 3: Install Grafana in CentOS 7
12. Now, install Grafana from its official YUM repository, start by adding the following configuration to /etc/yum.repos.d/grafana.repo repository file.
[grafana]
name=grafana
baseurl=https://packagecloud.io/grafana/stable/el/7/$basearch
repo_gpgcheck=1
enabled=1
gpgcheck=1
gpgkey=https://packagecloud.io/gpg.key https://grafanarel.s3.amazonaws.com/RPM-GPG-KEY-grafana
sslverify=1
sslcacert=/etc/pki/tls/certs/ca-bundle.crt
13. After adding the repository to the YUM configuration, install the Grafana package by running.
# yum install grafana
14. Once you have installed Grafana, reload systemd manager configuration, start the grafana server, check if the service is up and running by viewing its status and enable it to auto-start at boot time.
# systemctl daemon-reload
# systemctl start grafana-server
# systemctl status grafana-server
# systemctl enable grafana-server
15. Next, open port 3000 which Grafana server listens on, in your firewall using the firewall-cmd.
# firewall-cmd --add-port=3000/tcp --permanent
# firewall-cmd --reload
Step 4: Monitor CentOS 7 Server Metrics Via Grafana
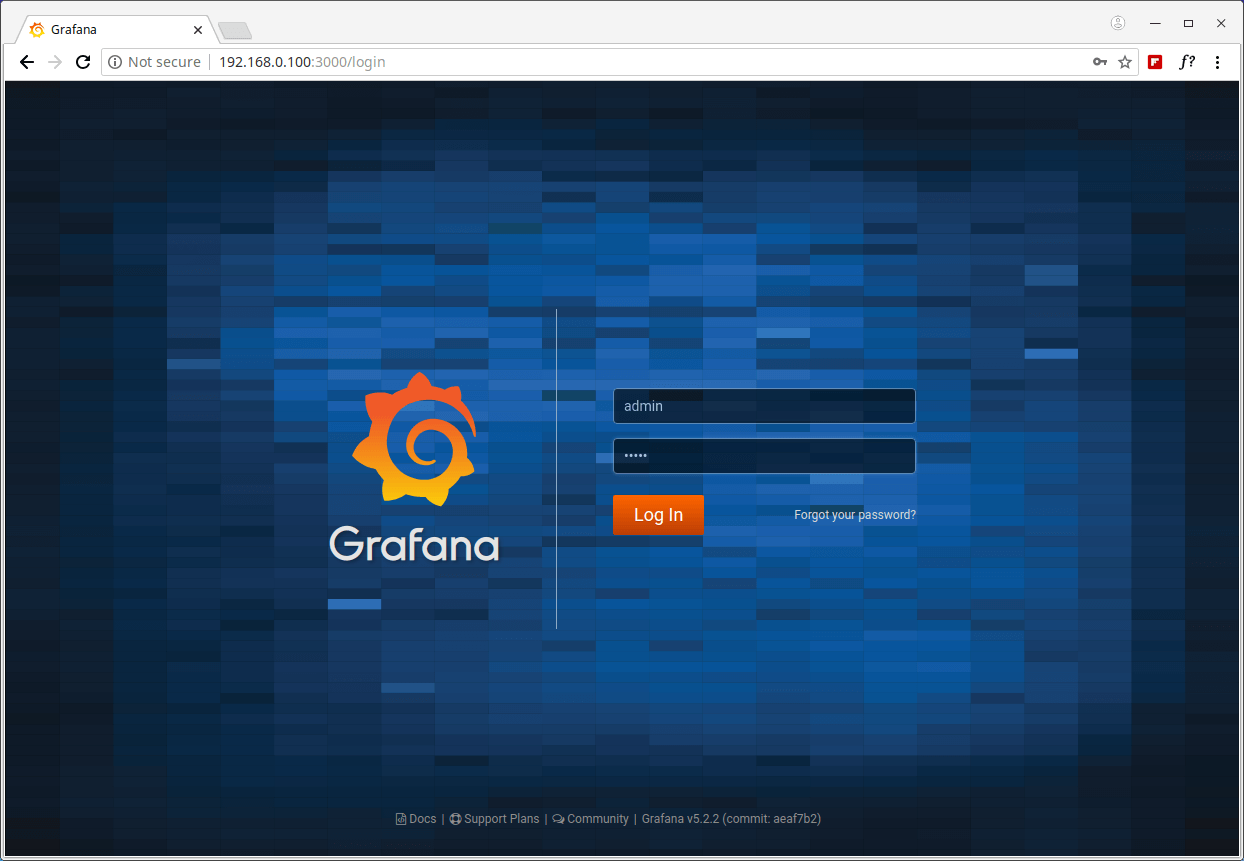
16. At this point, you can use the following URL to access Grafana web interface, which will redirect to the login page, use the default credentials to login.
URL: http://SERVER_IP:3000
Username: admin
Password: admin
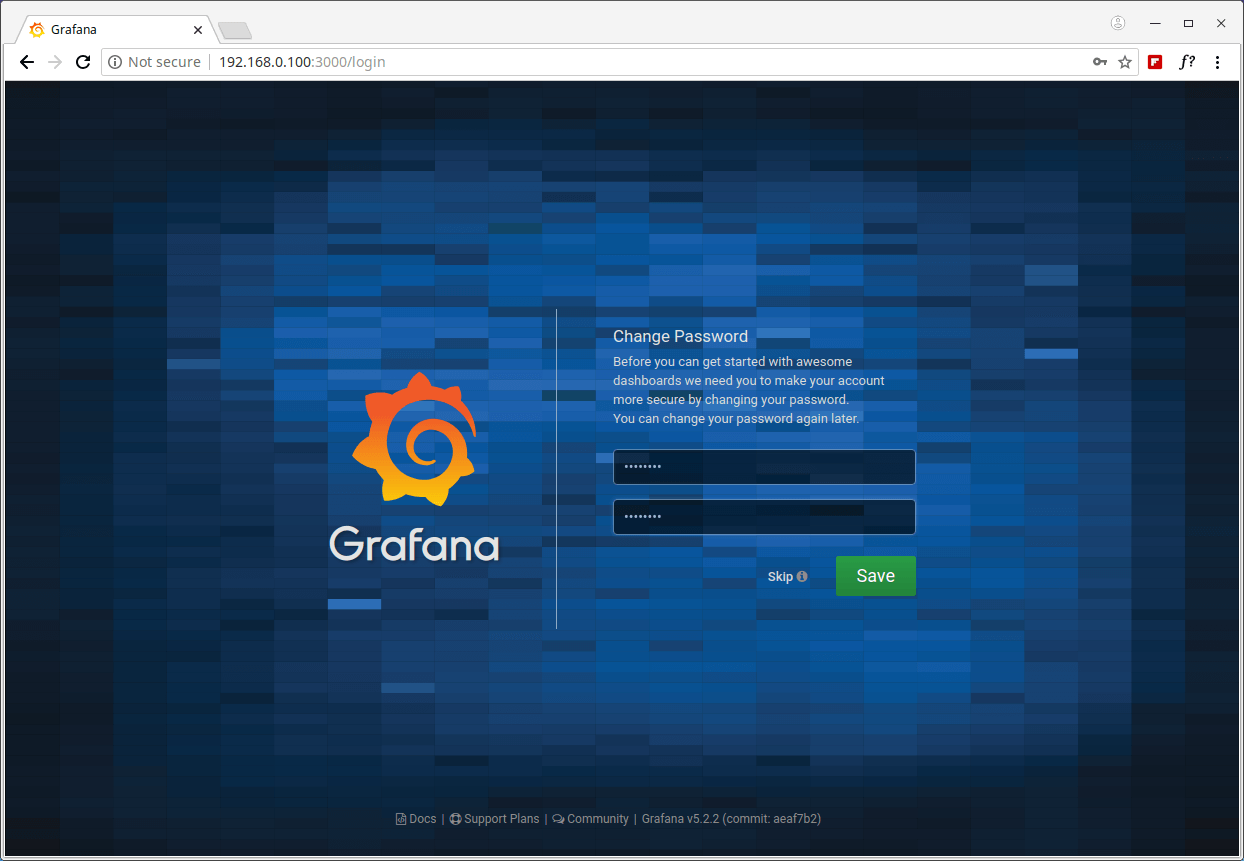
You will be asked to create a new password, once you have done that, you will be redirected to the home dashboard, as shown in the screenshot below.
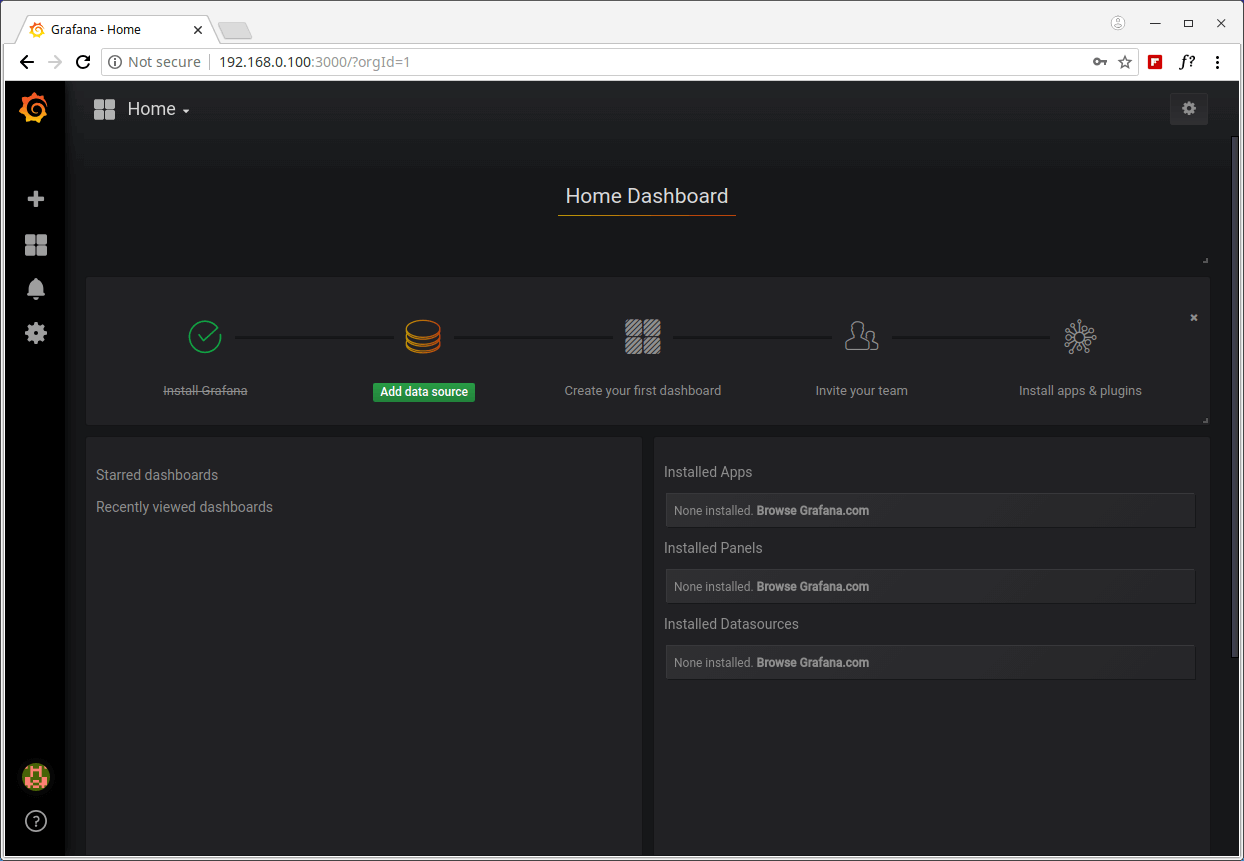
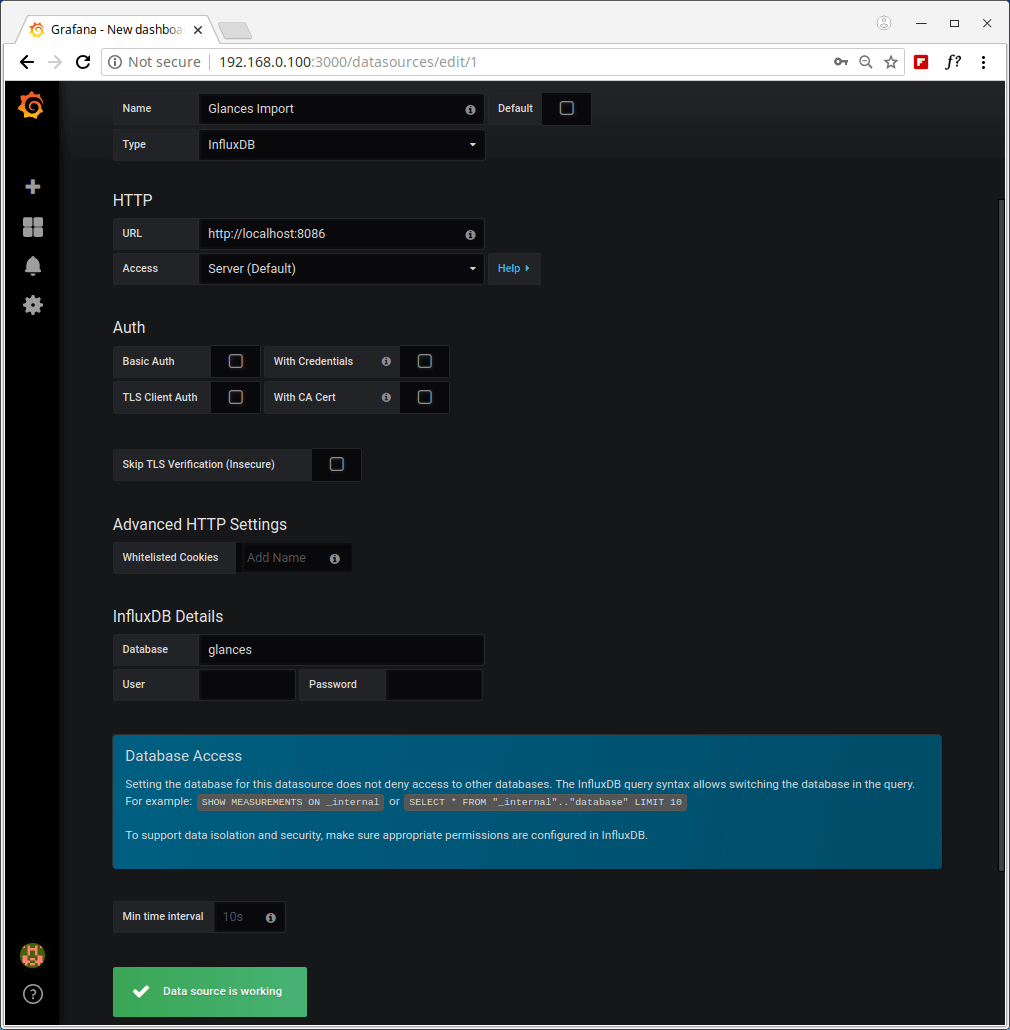
17. Next, click on Create your first data source, which should be an InfluxDB database. Under Settings, enter a suitable name e.g Glances Import, then use the following values for the other two important variables (HTTP URL and InfluxDB Database) as shown in the screenshot.
HTTP URL: http://localhost:8086
InfluxDB Details - Database: glances
Then click on Save & Test to connect to the data source. You should receive a feedback indicating “Data source is working”.
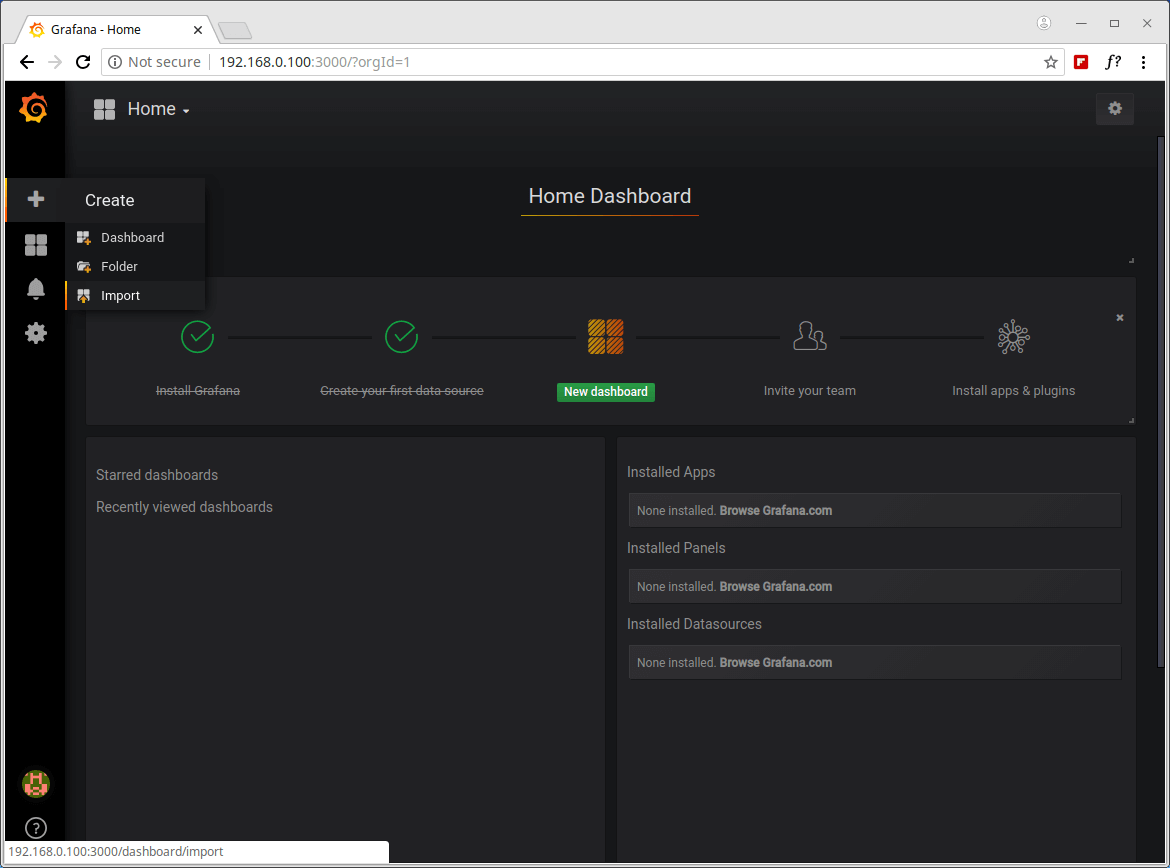
18. Now you need to import the Glances dashboard. Click on the plus (+) and go to Import as shown in the screenshot.
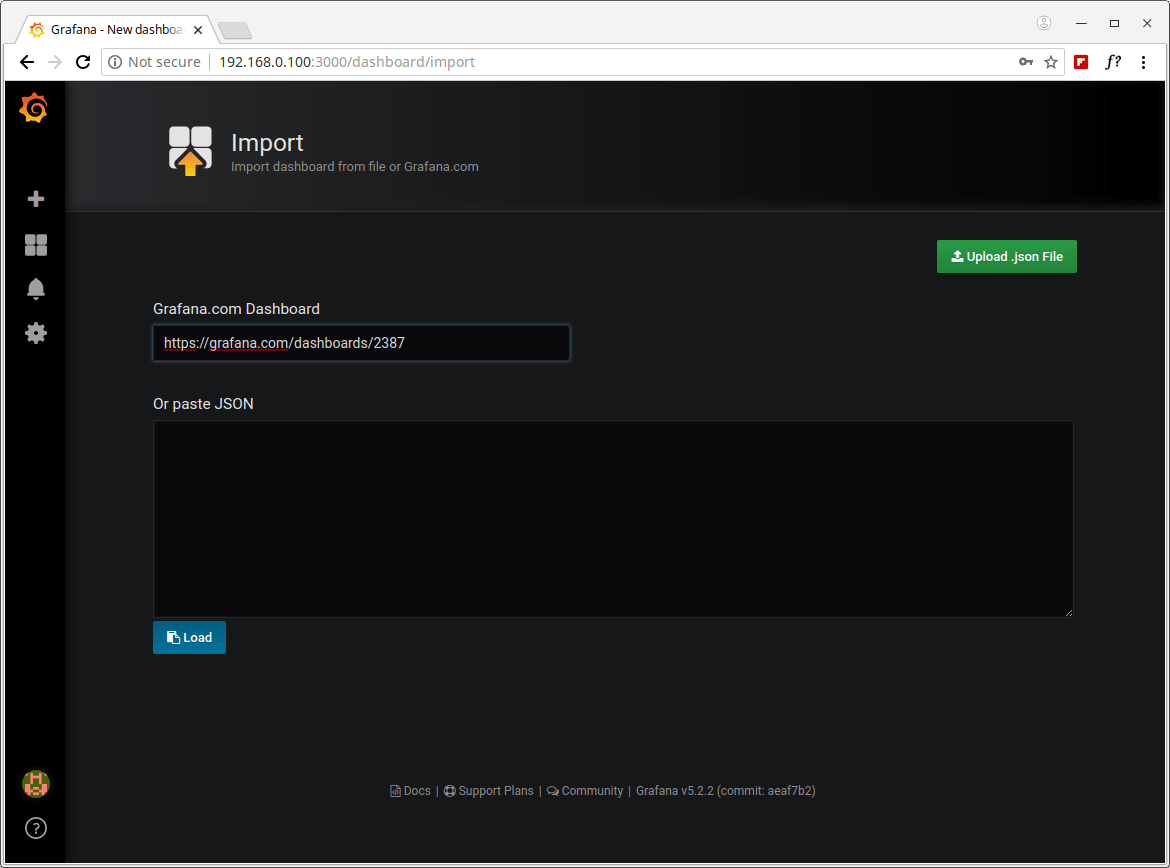
17. You will need either the Glances Dashboard URL or ID or upload its .JSON file which you can find from Grafana.com. In this case, we will use the Glances Dashboard created by the developer of Glances, its URL is https://grafana.com/dashboards/2387 or ID is 2387.
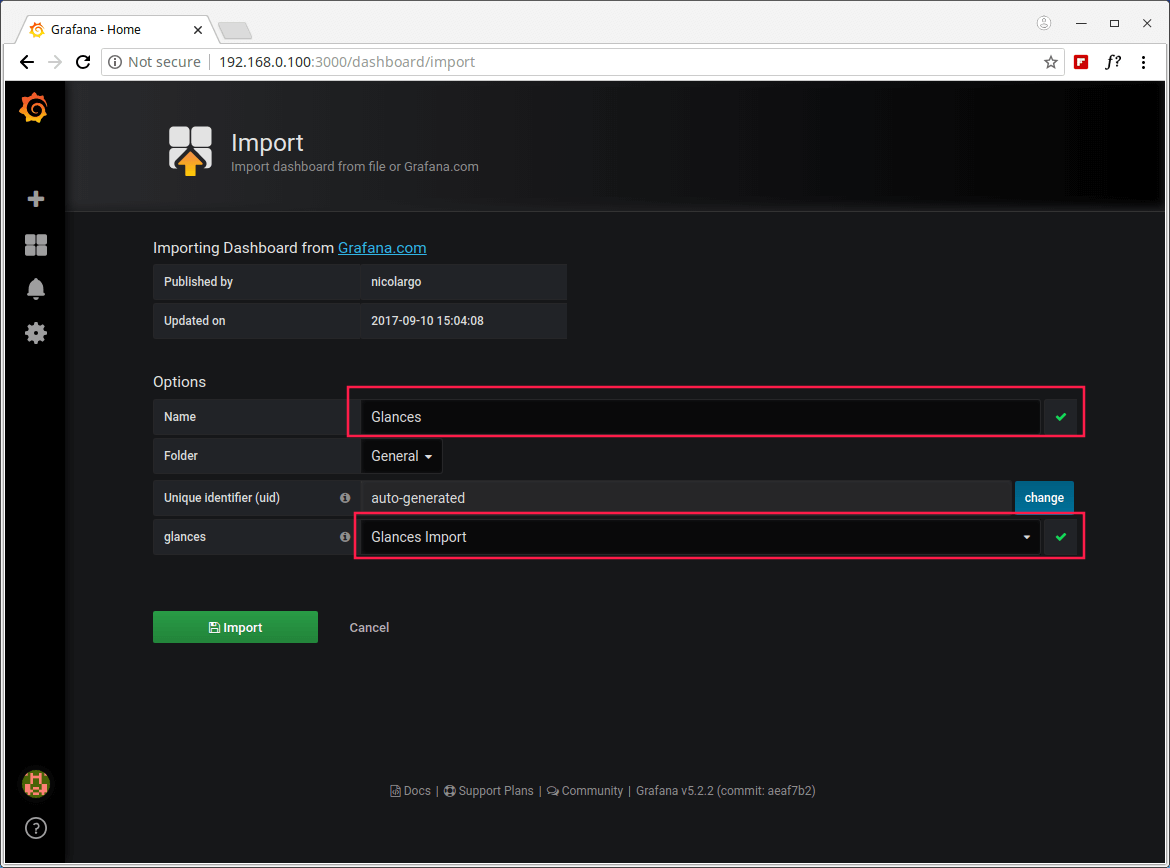
18. Once the Grafana dashboard has been loaded, under options, find glances and choose an InluxDB data source (Glances Import) which you created earlier on, then click on Import as shown in the following screenshot.
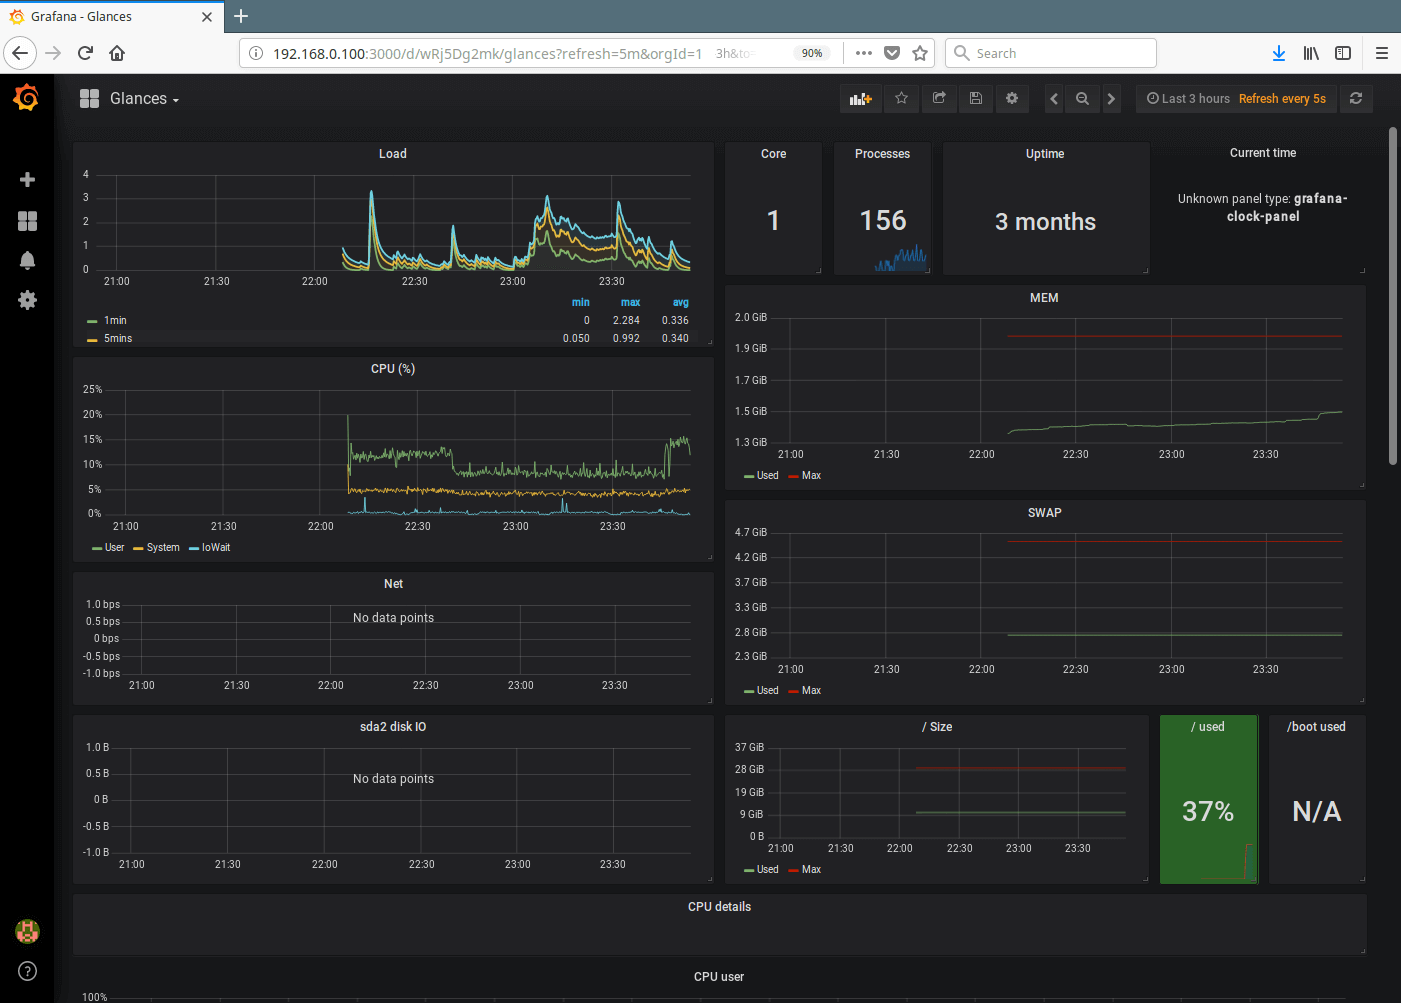
19. After successfully importing the Glances dashboard, you should be able to watch graphs showing metrics from your server as provided by glances via influxdb.
That’s all for now! In this article, we have explained how to monitor CentOS 7 server with Glances, InfluxDB and Grafana. If you have any queries, or information to share, use the comment form below to do so.


Sample Output
● glances.service - Glances
   Loaded: loaded (/etc/systemd/system/glances.service; enabled; vendor preset: disabled)
   Active: activating (auto-restart) (Result: exit-code) since Mon 2020-09-07 14:40:36 CEST; 16s ago
  Process: 3347 ExecStart=/usr/bin/glances --config /home/adrian/.config/glances/glances.conf --quiet --export-influxdb --disable-plugin ip (code=exited, status=2)
 Main PID: 3347 (code=exited, status=2)

Sep 07 14:40:36 mail.sysyadmin.info.pl systemd[1]: glances.service: main process exited, code=exited, status=2/INVALIDARGUMENT
Sep 07 14:40:36 mail.sysyadmin.info.pl systemd[1]: Unit glances.service entered failed state.
Sep 07 14:40:36 mail.sysyadmin.info.pl systemd[1]: glances.service failed.

glances: error: unrecognized arguments: --export-influxdb
Sep  7 14:44:39 mail systemd[1]: glances.service: main process exited, code=exited, status=2/INVALIDARGUMENT
Sep  7 14:44:39 mail systemd[1]: Unit glances.service entered failed state.
Sep  7 14:44:39 mail systemd[1]: glances.service failed.
Sep  7 14:44:48 mail systemd[1]: Reloading.
Sep  7 14:44:55 mail systemd[1]: Stopped Glances.
Sep  7 14:45:01 mail systemd[1]: Started Glances.
Sep  7 14:45:03 mail glances[3458]: Traceback (most recent call last):
Sep  7 14:45:03 mail glances[3458]: File "/usr/bin/glances", line 9, in
Sep  7 14:45:03 mail glances[3458]: load_entry_point('Glances==3.1.5', 'console_scripts', 'glances')()
Sep  7 14:45:03 mail glances[3458]: File "/usr/lib/python2.7/site-packages/glances/__init__.py", line 143, in main
Sep  7 14:45:03 mail glances[3458]: start(config=config, args=args)
Sep  7 14:45:03 mail glances[3458]: File "/usr/lib/python2.7/site-packages/glances/__init__.py", line 108, in start
Sep  7 14:45:03 mail glances[3458]: mode = GlancesMode(config=config, args=args)
Sep  7 14:45:03 mail glances[3458]: File "/usr/lib/python2.7/site-packages/glances/standalone.py", line 51, in __init__
Sep  7 14:45:03 mail glances[3458]: self.stats = GlancesStats(config=config, args=args)
Sep  7 14:45:03 mail glances[3458]: File "/usr/lib/python2.7/site-packages/glances/stats.py", line 48, in __init__
Sep  7 14:45:03 mail glances[3458]: self.load_modules(self.args)
Sep  7 14:45:03 mail glances[3458]: File "/usr/lib/python2.7/site-packages/glances/stats.py", line 103, in load_modules
Sep  7 14:45:03 mail glances[3458]: self.load_exports(args=args)
Sep  7 14:45:03 mail glances[3458]: File "/usr/lib/python2.7/site-packages/glances/stats.py", line 178, in load_exports
Sep  7 14:45:03 mail glances[3458]: export_module = __import__(self._exports_all[export_name])
Sep  7 14:45:03 mail glances[3458]: File "/usr/lib/python2.7/site-packages/glances/exports/glances_influxdb.py", line 27, in
Sep  7 14:45:03 mail glances[3458]: from influxdb import InfluxDBClient
Sep  7 14:45:03 mail glances[3458]: ImportError: No module named influxdb
Sep  7 14:45:05 mail systemd[1]: glances.service: main process exited, code=exited, status=1/FAILURE
Sep  7 14:45:05 mail systemd[1]: Unit glances.service entered failed state.
Sep  7 14:45:05 mail systemd[1]: glances.service failed.
Sep  7 14:45:05 mail dbus[498]: [system] Activating service name='org.fedoraproject.Setroubleshootd' (using servicehelper)
Sep  7 14:45:07 mail dbus[498]: [system] Successfully activated service 'org.fedoraproject.Setroubleshootd'
Sep  7 14:45:10 mail setroubleshoot: SELinux is preventing /usr/bin/python2.7
from read access on the file disable_ipv6. For complete SELinux messages run: sealert -l 66e1e5bf-322d-4bd9-911e
-c580274a0951
Seems I need to play with SELinux using my article from my own website LOL.
Additionally, log from /tmp/glances-root.log
Can you review the post? Still have issues with the glances. Even after reading all comments and changing the entry in service for glances.
None of the solutions works.
Proper grafana repo:
Hmmm, I followed this but all I see is ‘No Data points’
Nice article.
For Glances v 3 they have change the syntax, the command it’s now:
ExecStart=/usr/bin/glances --config /home/admin/.config/glances/glances.conf --quiet --export influxdb --disable-plugin ipWhy use 3 programs and a complicated flow of data instead of using netdata? Thanks in advance
Thank you very much! I used it (with modifications) on Ubuntu 16.04.5: It works generally very well!
But some data series aren’t displayed! To example disk I/O and the network RX/TX …
Have somebody an idea how to fix this?
Thank you!
@Jakob
You can contact the developer of glances for a possible solution: https://nicolargo.github.io/glances/
I had found the error: A typical “greenhorn” mistake: I haven’t adjusted the InfluxDB query.
Now all is going pretty well, thank you very much for the article!
What did you use as your query? I can’t seem to find any references what query to use.
Process: 3043 ExecStart=/usr/bin/glances –config /home/admin/.config/glances/glances.conf –quiet –export-influxdb – -disable-ip (code=exited, status=2)
Main PID: 3043 (code=exited, status=2)
Aug 28 16:22:25 testmachine systemd[1]: Unit glances.service entered failed state.
Aug 28 16:22:25 testmachine systemd[1]: glances.service failed.
Ye there’s a typo in there I had this as well.
There’s a space between the 2 dashes at disable-ip and the config location assumes you are user ‘admin‘.
Just remove the dashes and fix the username.
ExecStart=/usr/bin/glances --config /home/YourUsername/.config/glances/glances.conf --quiet --export-influxdb --disable-ip
@Stephen,
Thanks for pointing out that typo, we’ve corrected the command in the article..
Very interesting!
Going to give this a go on debian.
Thanks for the write-up :)
@Stephen
Welcome, many thanks for the feedback.