In any packet-switched network, packets represent units of data that are transmitted between computers. It is the responsibility of network engineers and system administrators alike to monitor and inspect the packets for security and troubleshooting purposes.
To do this, they rely on software programs called network packet analyzers, with Wireshark perhaps being the most popular and used due to its versatility and easiness of use. On top of this, Wireshark allows you to not only monitor traffic in real-time but also to save it to a file for later inspection.
Related Read: Best Linux Bandwidth Monitoring Tools to Analyze Network Usage
In this article, we will share 10 tips on how to use Wireshark to analyze packets in your network and hope that when you reach the Summary section you will feel inclined to add it to your bookmarks.
Installing Wireshark in Linux
To install Wireshark, select the right installer for your operating system/architecture from https://www.wireshark.org/download.html.
Particularly, if you are using Linux, Wireshark must be available directly from your distribution’s repositories for an easier install at your convenience. Although versions may differ, the options and menus should be similar – if not identical in each one.
------------ On Debian/Ubuntu based Distros ------------
$ sudo apt-get install wireshark

------------ On CentOS/RHEL based Distros ------------
$ sudo yum install wireshark

------------ On Fedora 22+ Releases ------------
$ sudo dnf install wireshark
There is a known bug in Debian and derivatives that may prevent listing the network interfaces unless you use sudo to launch Wireshark. To fix this, follow the accepted answer in this post.
Once Wireshark is running, you can select the network interface that you want to monitor under Capture:
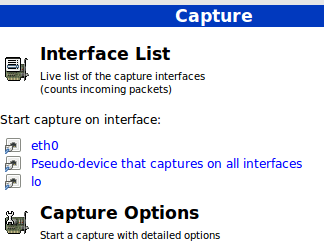
In this article, we will use eth0, but you can choose another one if you wish. Don’t click on the interface yet – we will do so later once we have reviewed a few capture options.
Setting Capture Options
The most useful capture options we will consider are:
- Network interface – As we explained before, we will only analyze packets coming through eth0, either incoming or outcoming.
- Capture filter – This option allows us to indicate what kind of traffic we want to monitor by port, protocol, or type.
Before we proceed with the tips, it is important to note that some organizations forbid the use of Wireshark in their networks. That said, if you are not utilizing Wireshark for personal purposes make sure your organization allows its use.
For the time being, just select eth0 from the dropdown list and click Start at the button. You will start seeing all traffic passing through that interface. Not really useful for monitoring purposes due to the high amount of packets inspected, but it’s a start.
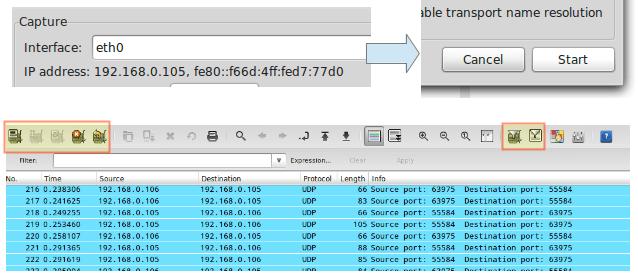
In the above image, we can also see the icons to list the available interfaces, to stop the current capture, and to restart it (red box on the left), and to configure and edit a filter (red box on the right). When you hover over one of these icons, a tooltip will be displayed to indicate what it does.
We will begin by illustrating capture options, whereas tips #7 through #10 will discuss how to do actually do something useful with a capture.
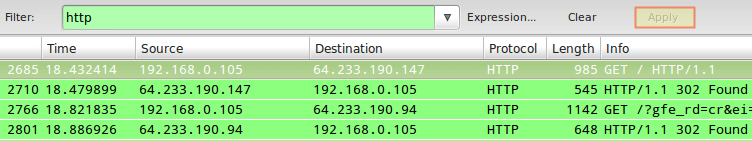
TIP #1 – Inspect HTTP Traffic
Type http in the filter box and click Apply. Launch your browser and go to any site you wish:
To begin every subsequent tip, stop the live capture and edit the capture filter.
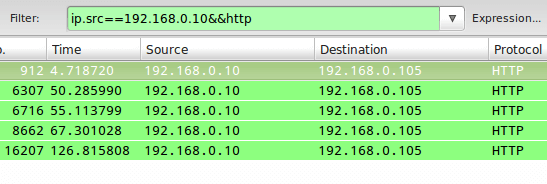
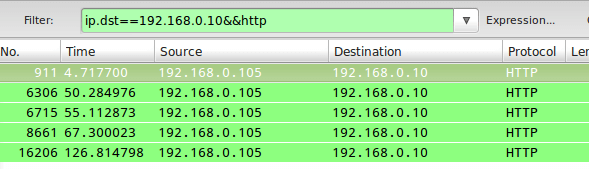
TIP #2 – Inspect HTTP Traffic from a Given IP Address
In this particular tip, we will prepend ip==192.168.0.10&& to the filter stanza to monitor HTTP traffic between the local computer and 192.168.0.10:
TIP #3 – Inspect HTTP Traffic to a Given IP Address
Closely related with #2, in this case, we will use ip.dst as part of the capture filter as follows:
ip.dst==192.168.0.10&&http
To combine tips #2 and #3, you can use ip.addr in the filter rule instead of ip.src or ip.dst.
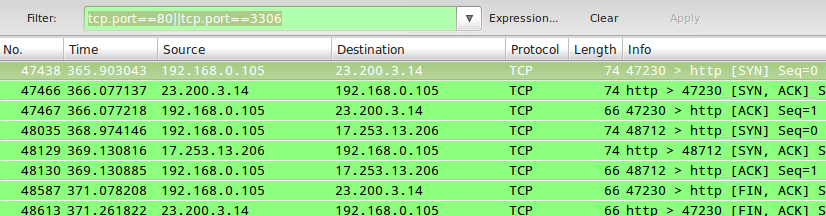
TIP #4 – Monitor Apache and MySQL Network Traffic
Sometimes you will be interested in inspecting traffic that matches either (or both) conditions whatsoever. For example, to monitor traffic on TCP ports 80 (webserver) and 3306 (MySQL / MariaDB database server), you can use an OR condition in the capture filter:
tcp.port==80||tcp.port==3306
In tips #2 and #3, || and the word or produce the same results. Same with && and the word and.
TIP #5 – Reject Packets to Given IP Address
To exclude packets not matching the filter rule, use ! and enclose the rule within parentheses. For example, to exclude packages originating from or being directed to a given IP address, you can use:
!(ip.addr == 192.168.0.10)
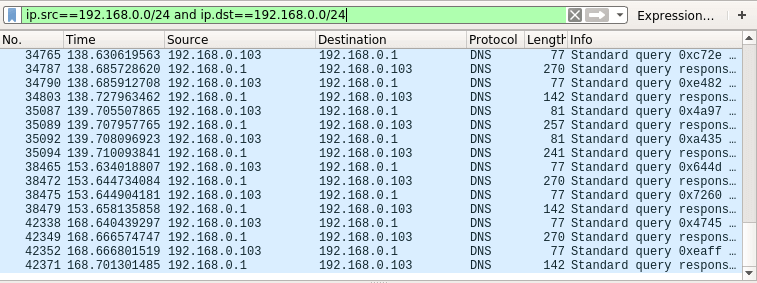
TIP #6 – Monitor Local Network Traffic (192.168.0.0/24)
The following filter rule will display only local traffic and exclude packets going to and coming from the Internet:
ip.src==192.168.0.0/24 and ip.dst==192.168.0.0/24
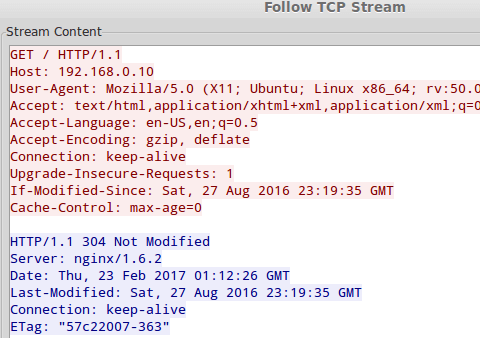
TIP #7 – Monitor the Contents of a TCP Conversation
To inspect the contents of a TCP conversation (data exchange), right-click on a given packet and choose Follow TCP stream. A window will pop-up with the content of the conversation.
This will include HTTP headers if we are inspecting web traffic, and also any plain text credentials transmitted during the process if any.
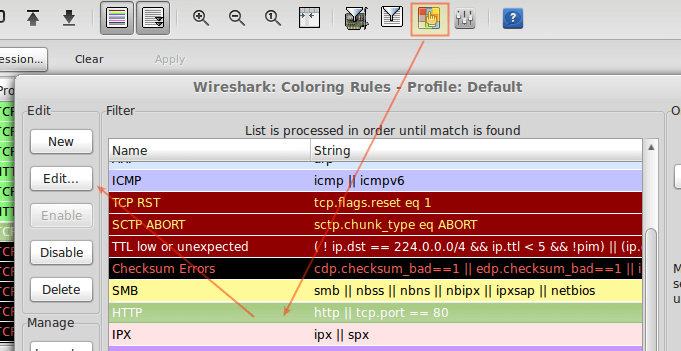
TIP #8 – Edit Coloring Rules
By now I am sure you already noticed that each row in the capture window is colored. By default, HTTP traffic appears in the green background with black text, whereas checksum errors are shown in red text with a black background.
If you wish to change these settings, click the Edit coloring rules icon, choose a given filter, and click Edit.
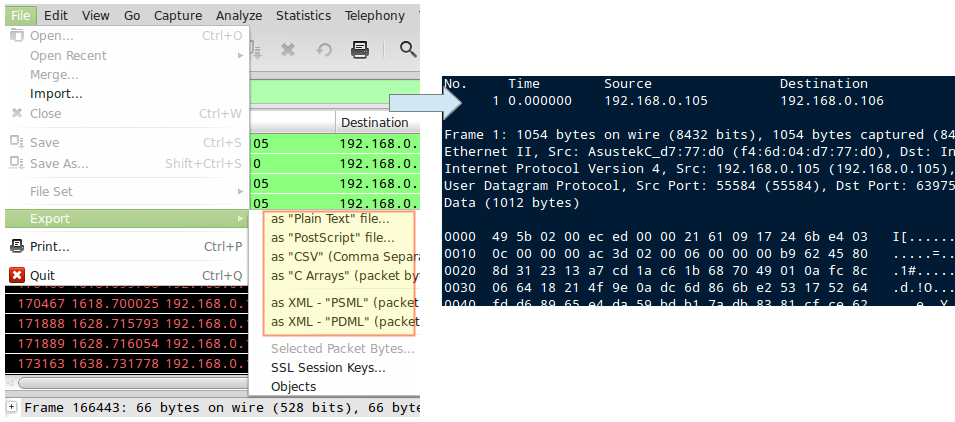
TIP #9 – Save the Capture to a File
Saving the contents of capture will allow us to be able to inspect it with greater detail. To do this, go to File → Export and choose an export format from the list:
TIP #10 – Practice with Capture Samples
If you think your network is “boring”, Wireshark provides a series of sample capture files that you can use to practice and learn. You can download these SampleCaptures and import them via the File → Import menu.
Summary
Wireshark is free and open-source software, as you can see in the FAQs section of the official website. You can configure a capture filter either before or after starting an inspection.
In case you didn’t notice, the filter has an autocomplete feature that allows you to easily search for the most used options that you can customize later. With that, the sky is the limit!
As always, don’t hesitate to drop us a line using the comment form below if you have any questions or observations about this article.


nice articles, could you put more intermediate or professional examples?
I was expecting some instructions on monitor mode for capturing remote interface.
Very nice post!
I believe you are missing the .src in tip #4
Thank you for this post! Found it and resolved my problem immediately after reading! Awesome! :)
@Tek,
Glad to hear that! Would you mind explaining what was your problem and how you actually solved it?
When i type “yum install wireshark-gnome” , it says no package found. please resolve this issue . i tried to find out on google, but failed to get any specific solution. I also downloaded .rpm files of wireshark and wireshark-gnome, but they require dependencies.
I just installed Wireshark on my Fedora 20 box. Try running “yum install wireshark” I found on one post that you need both packages. wireshark and wireshark-gnome.
Manideep,
Try doing yum search all wireshark. This should return the list of packages with wireshark in their name or description. What distribution are you using? Please note that the package name should be wireshark, not wireshark-gnome.
Hi everyone. I installed it here in my server CENTOS 5 and after run the wireshark, look for me ((wireshark:5941): Gtk-WARNING **: cannot open display:) what i can do for fix it ?
Thanks
Ps: I’ve try run with my user without be root. Just i try run nameuser$ wireshark but he doesn’t work fine.
@Roberson,
Try to add following line in /etc/sudoers file
CentOS 5!?!? Are you really using a GUI version of CentOS 5 in 2017?
Hi,
Also besides the above observation, I just wanted to let you know that I have installed the gtk+, glib after installing wireshark.
Hi Thanks for very descriptive info on Wireshark. It was very helpfull.
However, I am facing some issues while trying to open wireshark from command prompt.
[root@p1-vbu1-slot1-diam5 ~]# wireshark
(wireshark:14036): Gtk-WARNING **: cannot open display:
[root@p1-vbu1-slot1-diam5 ~]# wireshark –display=:0
(wireshark:14047): Gtk-WARNING **: cannot open display: :0
[root@p1-vbu1-slot1-diam5 ~]#
Niranjan
It’s something related to X windows display. which is not properly set.
Why would you open wireshark from the command line in a GUI environment?
You know why. You launch a GUI app from console when it doesn’t initiate from GUI interface, to get a lead of the problem. A GUI app that doesn’t initiate from console, doesn’t run from GUI environment either. Again, you know that :-)
Thanks for putting this up I needed to analyze some traffic on my box.
Good to hear!