Some of the popular and frequently used system resource-generating tools available on the Linux platform include vmstat, netstat, iostat, ifstat, and mpstat.
They are used for reporting statistics from different system components such as virtual memory, network connections and interfaces, CPU, input/output devices, and more.
As a system administrator, you may be looking for that one tool that can give you a good amount of the information provided by the above tools, even more, a single and powerful tool that has additional features and capabilities, then look no further than dool.
dool is a powerful, flexible, and versatile command line tool for monitoring various aspects of your Linux system resources such as cpu, memory, network, load average, etc.
It comes with extra features, and counters and it is highly extensible, users with Python knowledge can build their plugins.
Features of dool:
- Joins information from vmstat, netstat, iostat, ifstat and mpstat tools
- Displays statistics simultaneously
- Orders counters and highly-extensible
- Supports summarizing of grouped block/network devices
- Displays interrupts per device
- Works on accurate timeframes, no timeshifts when a system is stressed
- Supports colored output, it indicates different units in different colors
- Shows exact units and limits conversion mistakes as much as possible
- Supports exporting of CSV output to Gnumeric and Excel documents
How to Install Dool in Linux Systems
To install Dool on modern Linux distributions, you need to clone the Git repository and install it to monitor a Linux system during performance tuning tests or troubleshooting exercises.
git clone https://github.com/scottchiefbaker/dool.git
cd dool
./install.py
OR
sudo ./install.py
It works in real-time, outputting selective information in columns, including the magnitude and units for stats displayed after every second, by default.
Note: The dool output is aimed specifically for human interpretation, not as input for other tools to process.
Below is an output is seen after running the dool command without any options and arguments.
dool
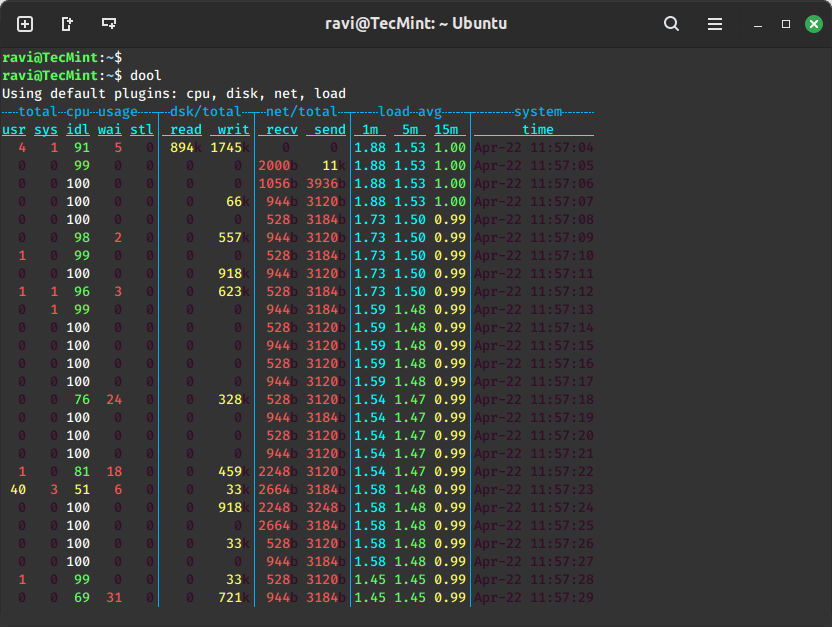
The output above indicates:
- cpu usage: cpu usage by a user (usr) processes, system (sys) processes, as well as the number of idle (idl) and waiting (wai) processes, and stolen time (stl).
- disk stats: total number of read (read) and write (writ) operations on disks.
- network stats: the total amount of bytes received (recv) and sent (send) on network interfaces.
- load avg: shows the load average of the system over different time intervals (1 minute, 5 minutes, and 15 minutes).
- System stats: provides the timestamp indicating when the data was collected.
To display information provided by vmstat, use the -v or --vmstat option:
dool --vmstat
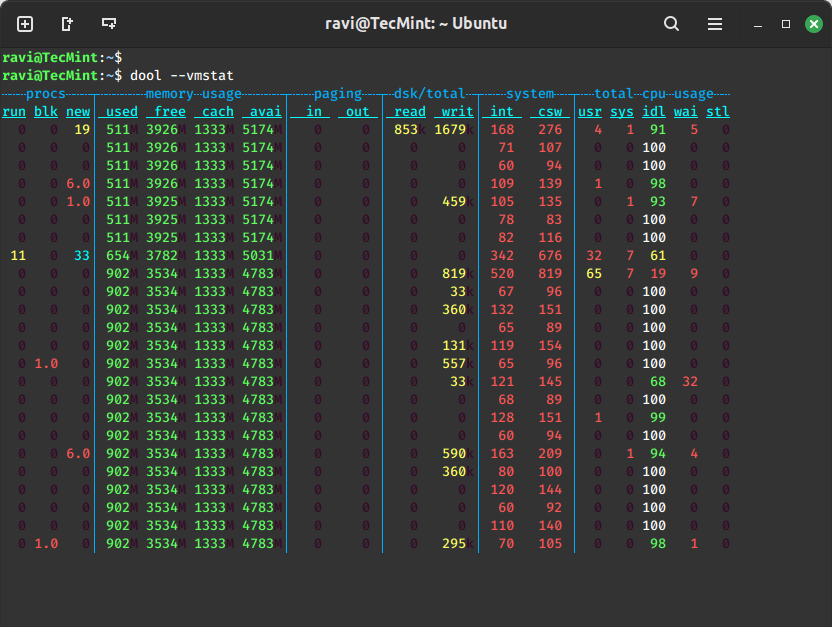
In the image above, dstat displays:
- Process stats: number of running (run), blocked (BLK), and new (new) spawned processes.
- Memory stats: the amount of used (used), buffered (buff), cached (catch), and free (free) memory.
I already explained the last three sections (paging, disk, and system stats) in the previous example.
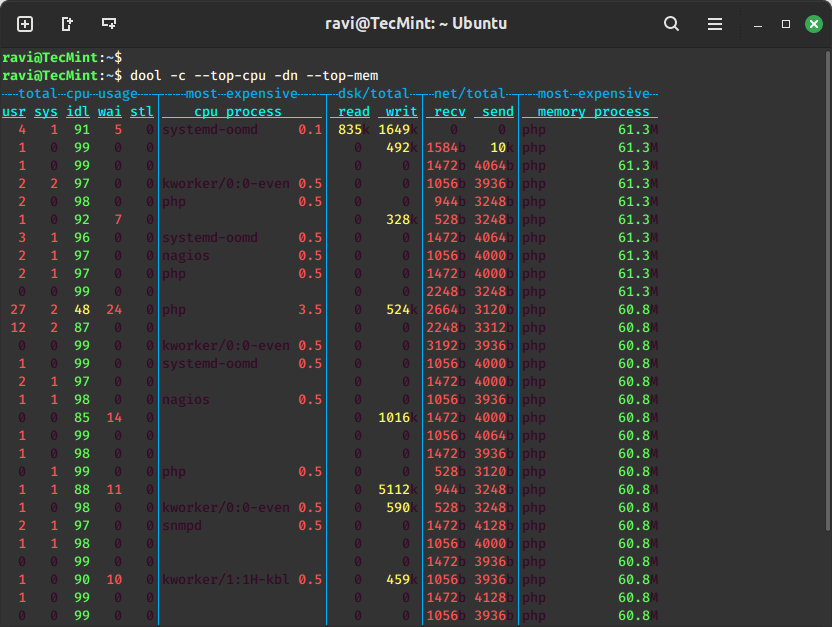
Let us dive into some advanced dool system monitoring commands. In the next example, we want to monitor a single program that is using the most CPU and consuming the most amount of memory.
The options in the command are:
-c– cpu usage--top-cpu– a process using most CPU-dn– disk and network stats--top-mem– process consuming the most memory
$ dool -c --top-cpu -dn --top-mem
Additionally, you can also store the output of dool in a .csv file for analysis at a later time by enabling the --output option as in the example below.
Here, we are displaying the time, cpu, mem, and system load stats with a one-second delay between 5 updates (counts).
dool --time --cpu --mem --load --output report.csv 1 5
Once the report is generated, you can view it using any text editor or spreadsheet application that supports CSV files.
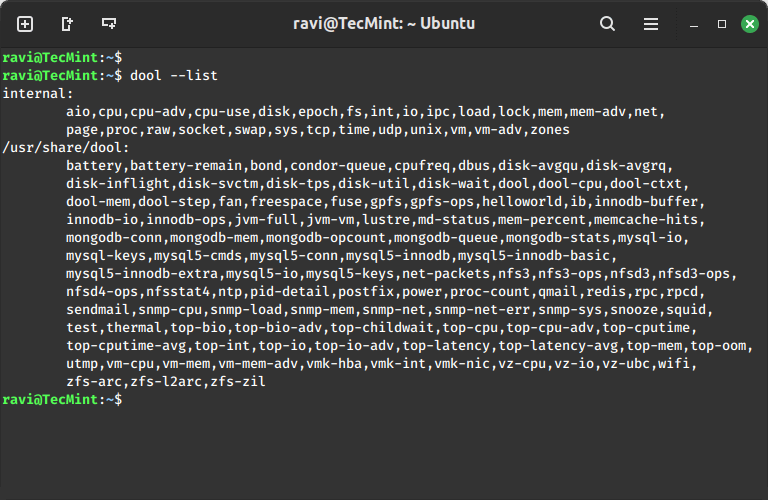
There are several internal (such as options used in the previous example) and external plugins you can use with dool, to view a list of all available plugins, run the command below:
dool --list
For more usage information, run the man dool command or visit the dool github homepage.
dool is a versatile, all-in-one system resources statistics generating tool, it combines information from several other tools such as vmstat, mpstat, iostat, netstat, and ifstat.
I hope this review will be helpful to you, most importantly, you can share with us any suggestions, or supplementary ideas to improve the article and also give us feedback about your experience using dool through the comment section below.


In the screenshot for command “dstat –vmstat” there are 1.4 new processes. I’m surprised looking at non-integer amounts. Also, I can’t understand why there are 0 running processes most of the time.
Great post you have here, Aaron. Did you know that if you manage your server with RunCloud, these stats are available for you without having to install anything. We developed RunCloud which will configure your server to the best configuration so you can focus only on things that matters.