Less than two weeks ago, the Wannacry ransomware attack compromised thousands of computers, causing considerable losses to big companies and individuals alike. That, along with other widespread vulnerabilities found in recent years (such as the Shellshock bug), highlight the importance of staying on top of your mission-critical systems.
Although vulnerabilities often target one specific operating system or software component, examining the traffic that goes in and out of your network can be a significant help to protect the assets you are responsible for.
Suggested Read: 4 Good Open Source Log Monitoring and Management Tools for Linux
As I’m sure you already know, system logs are the first place where we should look for this information. To make this task easier, in this article we will explain how to install and use lnav, an advanced log file viewer. With lnav, you will be able to watch several types of logs simultaneously, navigate through the file using hotkeys, and generate a summarized histogram of accesses and errors. So keep reading!
Installing and Launching lnav in Linux
To install lnav, use the package management system of your distribution.
# aptitude install lnav          [Debian and derivatives]
# yum install epel-release lnav  [CentOS 7 and similar]
Once the installation is complete, launch lnav followed by the absolute path to the directory where the logs to be examined are located. Since this will be typically /var/log, let’s do:
# lnav /var/log/httpd
to inspect the logs of the Apache web server in a CentOS 7:
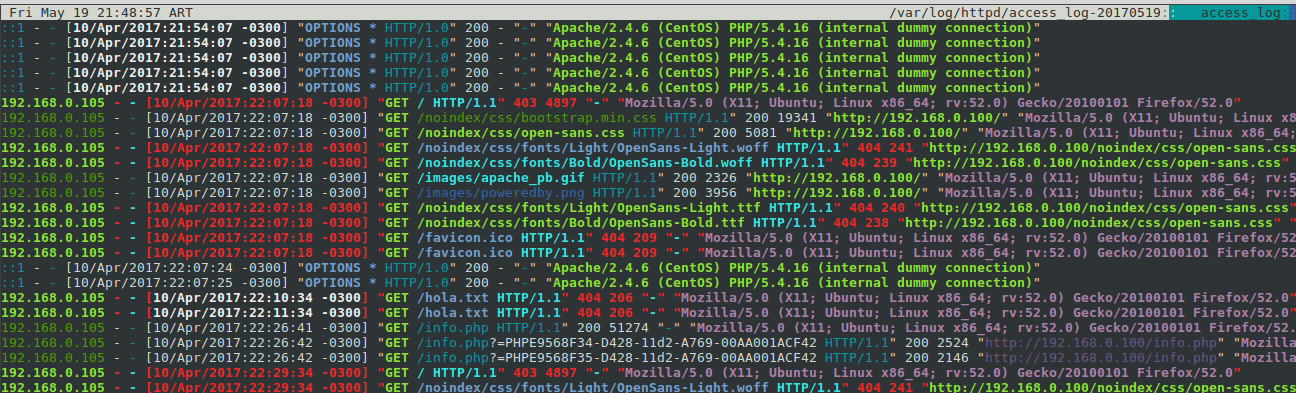
Let’s examine briefly the output shown in the previous image:
- The top right corner shows the files currently being inspected (access_log-20170519 and access_log). As you scroll down or up, you will note that the file names may change as you go from one to another.
- 40x HTTP responses (for example, Not Found or Forbidden) are displayed in bold, whereas 20x responses are shown in regular text.
- IP addresses appear in bold green.
That certainly looks nice, doesn’t it? But let’s dig a little deeper now, and we will see that lnav provides much more than a pretty-colored output.
If you are curious as to why error logs are not shown, you will find the answer later in this article. So keep reading!
Modifying the Output with Options and Hotkeys
Before we proceed any further, let’s list a few hotkeys that will allow us to move through the output of lnav and the available views more easily:
eorEto jump to the next / previous error message.worWto jump to the next / previous warning message.borBackspaceto move to the previous page.- Space to move to the next page.
gorGto move to the top / bottom of the current view.
When logs are rotated, old files may be compressed (or not) depending on the settings specified in the logrotate configuration files. To include compressed files in the output, launch lnav as follows:
# lnav -r /var/log/httpd
If you want to take a closer look at the way lnav operates, you can launch the program with the -d option followed by a filename where the debug information will be written to, like so:
# lnav /var/log/httpd -d lnav.txt
In this example, the debug information that is generated when lnav starts will be written to a file named lnav.txt inside the current working directory.
The first few lines of that file are shown in the following image:
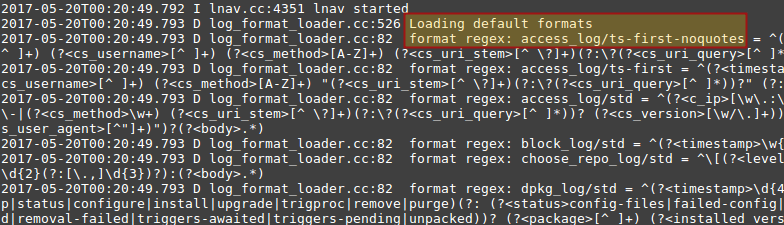
The highlighted text indicates that lnav loaded the default formats file and, more specifically, the access_log format to parse the Apache access log. Additionally, lnav allows to parse each output line so that the output becomes easier to visualize and understand.
Suggested Read: GoAccess (A Real-Time Apache and Nginx) Web Server Log Analyzer
To use this feature, launch the program and choose the line you want to parse. The selected line is always the one at the top of the window. Then press p and you should see the following result:
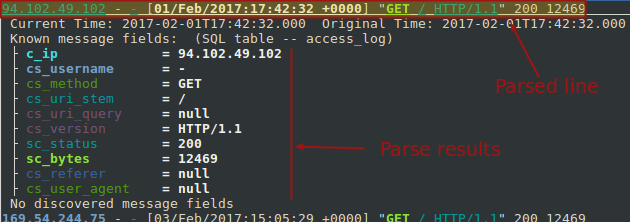
To return to normal mode, press p again.
Now, if you want to see a summary of the logs by date and time, press i. For example, the highlighted text indicates that on Monday, April 10th, between 10 and 11 pm, there were 37 HTTP requests with 14 resulting in errors.
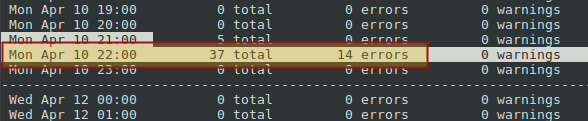
Once you have identified a potential problem based on the histogram as shown above, you can press i to exit the view to examine it in more detail using the parser as explained earlier. Or you can also use the built-in SQL capabilities by typing a semicolon and writing a standard query. For example, do:
;.schema
to view the available tables in the database schema. After identifying the right table (access_log in our case), let’s press q and then use the following query to return all the available information about requests coming from 195.154.230.31:
;SELECT * FROM access_log WHERE c_ip='195.154.230.31'
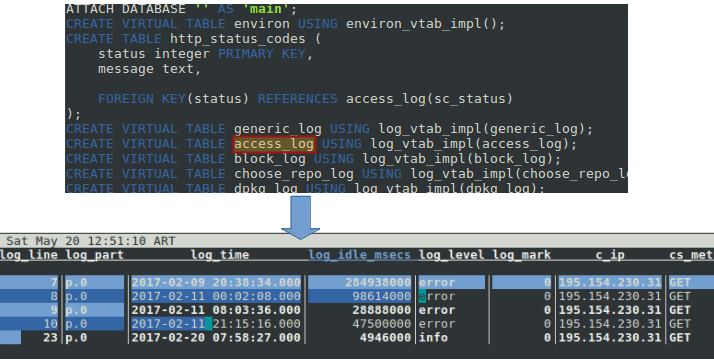
Note that we could have also filter the results by log_time. The point is, throw in a little SQL and the sky’s the limit as to what you can do with lnav.
Apache Default Log Formats
Many log formats are loaded by default with lnav and are thus parsed without our intervention. You can view the list in the Log Formats section in the official documentation.
Default formats are specified in ~/.lnav/formats/default/default-formats.json.sample, and others can be added ~/.lnav/formats using the .json extension.
However, editing these files requires a certain degree of familiarity with JSON (Javascript Object Notation) and with the PCRE (Perl-Compatible Regular Expressions) library.
So why did lnav not display the Apache error log files? The reason is that those logs do not match any regular expressions in the existing format files, and thus are treated as regular text files (meaning files without a given log format).
Suggested Read: How to Monitor Apache Web Server Load and Page Statistics
As mentioned earlier, you can create your own formats once you’re at least somewhat familiar with JSON and PCRE. This can come in handy, for example, if you have defined custom Apache logs.
Summary
Although we used the Apache access log to demonstrate how to use lnav, keep in mind that there are several other types of logs that can be viewed and parsed using this tool. If the tool does not recognize a specific log, you can create additional formats and install them following the indications provided here.
Do you have any questions or comments about this article? As always, feel free to let us know using the form below. We look forward to hearing from you!