If you’re working as a Linux/Unix system administrator, sure you know that you must have useful monitoring tools to monitor your system performance.
As monitoring tools are very important in the job of a system administrator or a server webmaster, it’s the best way to keep an eye on what’s going on inside your Linux system/server.
Today we’re going to talk about another 15 Linux monitoring tools that you may use to do the job.
ManageEngine Applications Manager
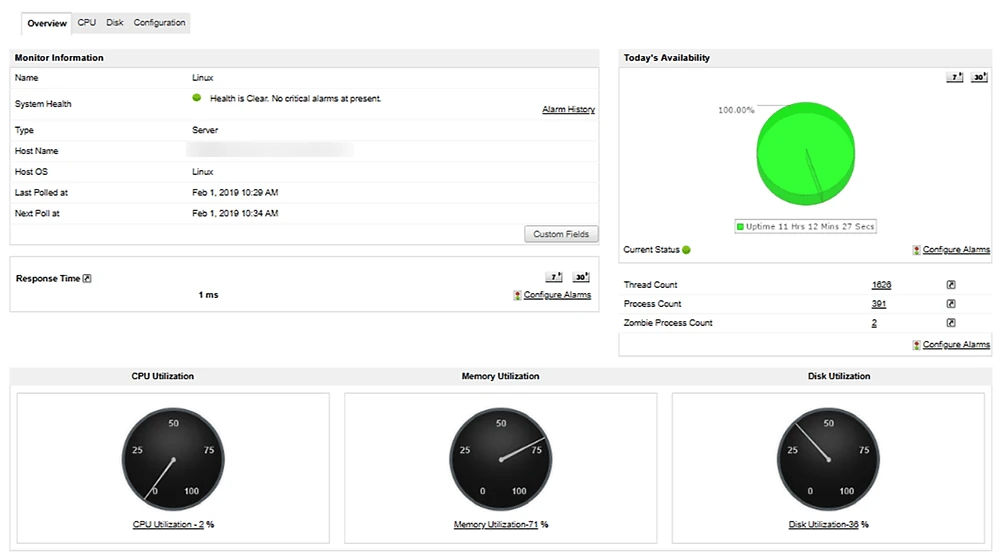
ManageEngine Applications Manager is a versatile and powerful server and application performance monitoring tool, specifically designed to meet the needs of modern, hybrid IT environments.
It offers comprehensive support for a wide range of Linux distributions, making it a versatile tool for administrators managing diverse environments.
Key Features:
- Supports a wide range of Linux distributions, making it adaptable for diverse IT environments. Essential for administrators managing multiple Linux-based systems across hybrid infrastructures.
- Tracks vital performance metrics such as CPU usage, memory utilization, disk I/O, network bandwidth, processes, and services.
- Supports monitoring of 150+ business applications and infrastructure elements, including both on-premise and cloud—from a single console.
- Provides support for both on-premise (data center) and cloud applications, ensuring seamless performance tracking and management across platforms.
- Enables users to run custom scripts and create custom monitoring templates. Additionally, it scales to monitor environments of all sizes, from small IT setups to large enterprises.
- Intelligent and powerful fault management helps you identify and pinpoint fault and its sources to reduce MTTR.
- Advanced analytics that help anticipate future resource usage and growth of databases.
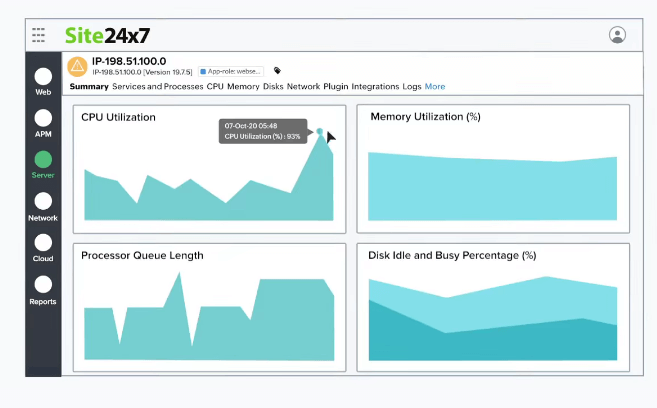
1. Site24x7’s Linux Monitoring Tool
With Site24x7’s monitoring platform, you can eliminate Linux server outages and performance issues by constantly tracking over 60 key performance metrics, including load average, CPU, memory, disk space, network bandwidth utilization, recent events, and Linux processes.
Configure thresholds for key performance metrics and receive instant alerts via SMS, email, mobile app push notifications, and other ITSM and collaboration tools whenever these thresholds are breached.
Site24x7 lets you automate incident remediation and makes your IT operations more agile and efficient.
Key Features:
- Better visibility into the processes that affect your server health and performance with the exclusive Top Process Chart.
- Services monitoring and Syslog monitoring for Linux servers.
- A single console for MSPs to monitor their customers’ IT infrastructures.
- Monitored metrics pushed via StatsD.
- Support for over 100 plugins, including Redis, MySQL, and NGINX.
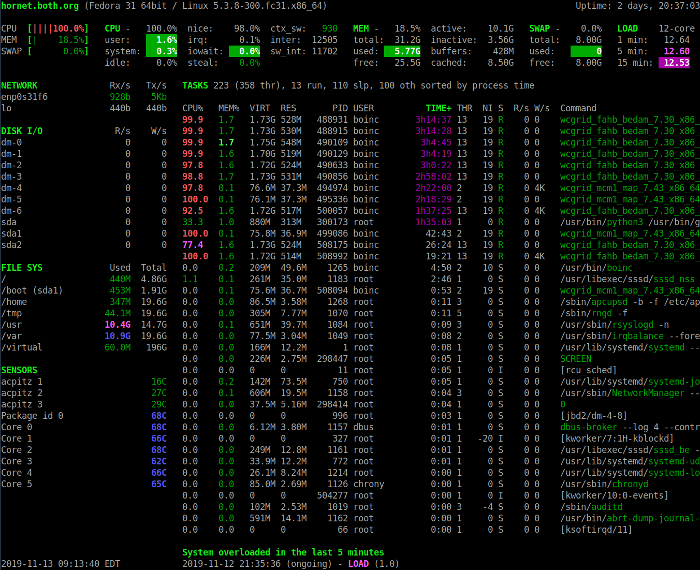
2. Glances – Real-Time Linux System Monitoring
Glances is a monitoring tool built to present as much information as possible in any terminal size, it automatically takes the terminal window size it runs on, in other words, it’s a responsive monitoring tool.
Glances not only show information about CPU and memory usage but also monitor filesystem I/O, network I/O, hardware temperatures, fan speeds, disk usage, and logical volume.
Install Glances in Linux
To install the latest stable version of Glances, just enter the following curl or wget command:
$ curl -L https://bit.ly/glances | /bin/bash
or
$ wget -O- https://bit.ly/glances | /bin/bash
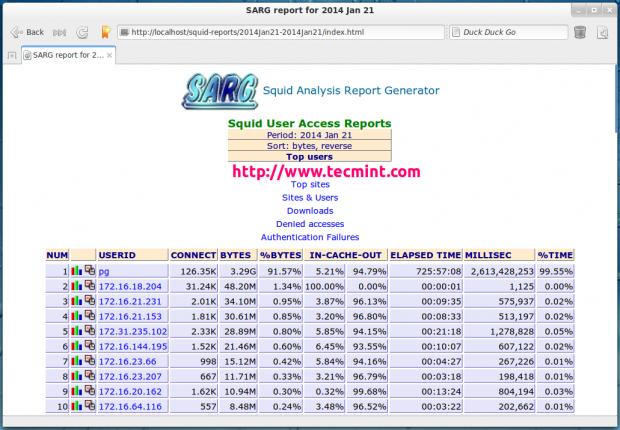
3. Sarg – Squid Bandwidth Monitoring
Sarg (Squid Analysis Report Generator) is a free and open-source tool that acts as a monitoring tool for your Squid proxy server, it creates reports about your Squid proxy server users, IP addresses, the sites they visit, and some other information.
For installation, read our article – Install Sarg “Squid Bandwidth Monitoring” Tool in Linux
4. Apache Status Monitoring
The mod_status is an Apache server module that allows you to monitor the workers’ status of the Apache server. It generates a report in an easy-to-read HTML format. It shows you the status of all the workers, how much CPU each one using, what requests are currently handled, and the number of working and not working workers.
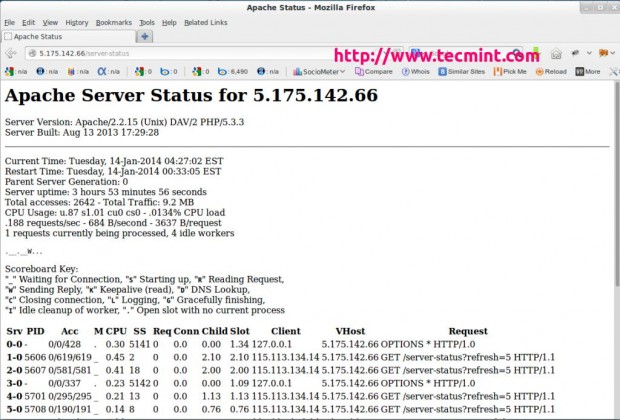
For installation, read our article – How to Monitor Apache Web Server Load and Page Statistics
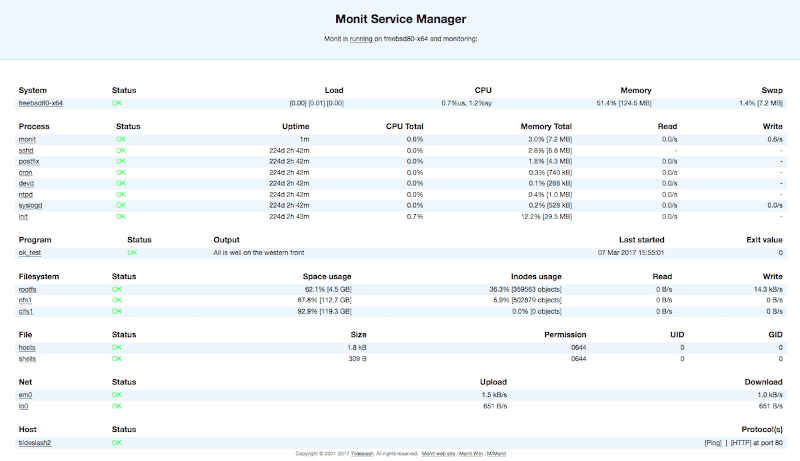
5. Monit – Linux Process and Services Monitoring
Monit is a nice program that monitors your Linux and Unix server, it can monitor everything you have on your server, from the main server (Apache, Nginx..) to file permissions, file hashes, and web services. Plus a lot of things.
Install Monit on Linux
To install the stable version of Monit, just enter the following command line:
$ sudo apt install monit          [On Debian, Ubuntu and Mint]
$ sudo yum install monit          [On RHEL/CentOS/Fedora and Rocky Linux/AlmaLinux]
$ sudo emerge -a app-admin/monit  [On Gentoo Linux]
$ sudo pacman -S monit            [On Arch Linux]
$ sudo zypper install monit       [On OpenSUSE]
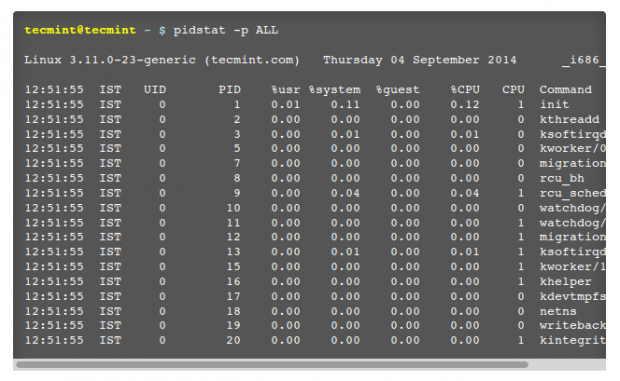
6. Sysstat – All-in-One System Performance Monitoring
Another useful monitoring tool for your Linux system is Sysstat – is not a real command, in fact, it’s just the name of the project, Sysstat, in fact, is a package that includes many performance monitoring tools like iostat, sadf, pidstat beside many other tools which shows you many statistics about your Linux OS.
Features of Sysstat
- It is available in all modern Linux distribution repositories by default.
- Ability to create statistics about RAM, CPU, and SWAP usage. Besides the ability to monitor Linux kernel activity, NFS server, Sockets, TTY, and filesystems.
- Ability to monitor input & output statistics for devices, tasks.. etc.
- Ability to output reports about network interfaces and devices, with support for IPv6.
- Sysstat can show you the power statistics (usage, devices, the fans’ speed.. etc) as well.
- Many other features…
Install Sysstat on Linux
To install the stable version of Sysstat, just enter the following command line:
$ sudo apt install sysstat          [On Debian, Ubuntu and Mint]
$ sudo yum install sysstat          [On RHEL/CentOS/Fedora and Rocky Linux/AlmaLinux]
$ sudo emerge -a app-admin/sysstat  [On Gentoo Linux]
$ sudo pacman -S sysstat            [On Arch Linux]
$ sudo zypper install sysstat       [On OpenSUSE]
For usage and examples, read our article – 20 Useful Commands of Sysstat
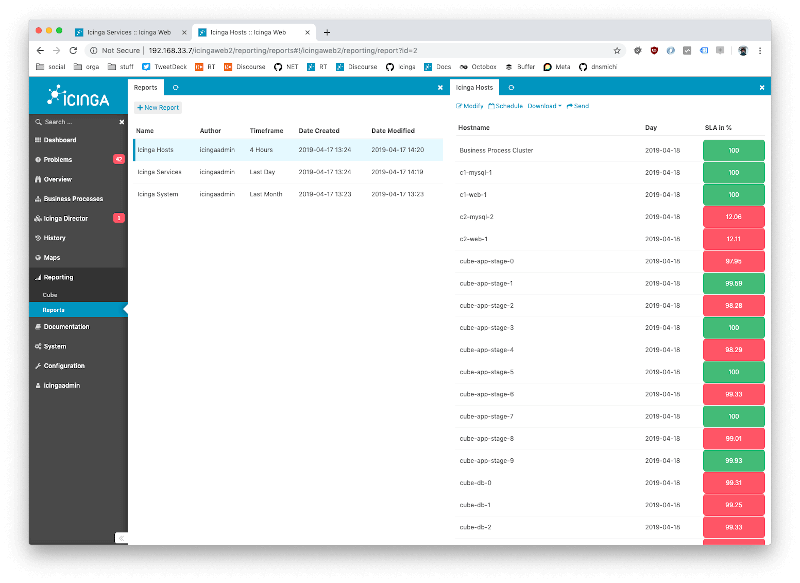
7. Icinga – Next Generation Server Monitoring
Unlike the other tools, Icinga is a network monitoring program, it shows you many options and information about your network connections, devices, and processes, it’s a very good choice for those who are looking for a good tool to monitor networking stuff.
Features of Icinga
- Icinga is also free and open-source.
- Very functional in monitoring everything you may have in networking.
- Support for MySQL and PostgreSQL is included.
- Real-time monitoring with A nice web interface.
- Very expandable with modules and extensions.
- Icinga supports applying services and actions to hosts.
- A lot more to discover…
For installation, read our article – Install Icinga2 on RHEL, Rocky, and AlmaLinux
8. Observium – Network Management and Monitoring
Observium is also a network monitoring tool, it was designed to help you manage your network of servers easily, there are 2 versions of it; Community Edition which is free and open-source, and the Commercial version which costs £1,000/year.
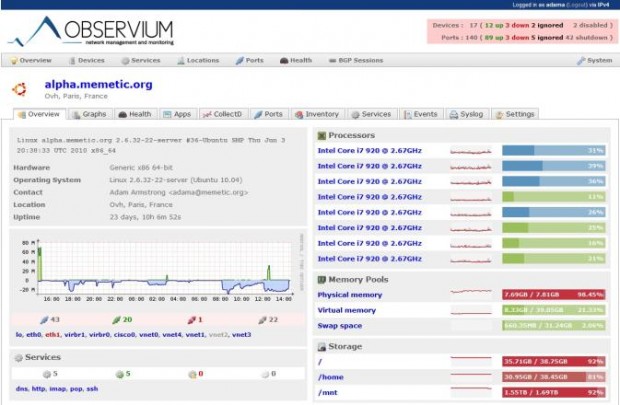
Features of Observium
- Written in PHP with MySQL database support.
- Has a nice web interface to output information and data.
- Ability to manage and monitor hundreds of hosts worldwide.
- The community version from it is licensed under the QPL license.
- Works on Windows, Linux, FreeBSD, and more.
For installation, read our article – Install Observium Network Management and Monitoring Tool in Linux
9. Web VMStat – System Statistics Monitoring
Web VMStat is a very simple web application programmer, that provides real-time system information usage, from CPU to RAM, Swap, and input/output information in html format.
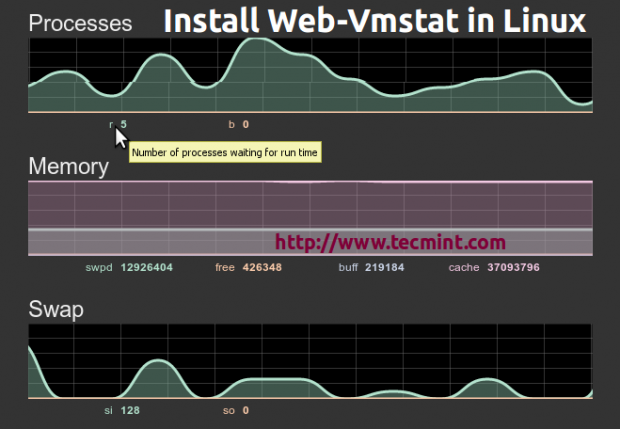
For installation, read our article – Web VMStat: A Real-Time System Statistics Tool for Linux
10. PHP Server Monitoring
Unlike the other tools on this list, PHP Server Monitoring is a web script written in PHP that helps you to manage your websites and hosts easily, it supports MySQL database and is released under GPL 3 or later.
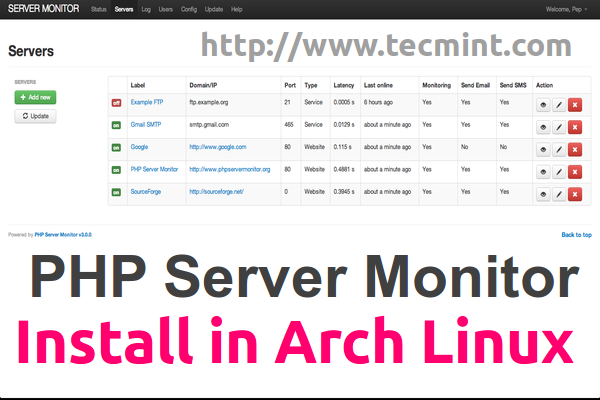
Features
- A nice web interface.
- Ability to send notifications to you via Email & SMS.
- Ability to view the most important information about CPU and RAM.
- A very modern logging system to log connection errors and emails that are sent.
- Support for cronjob services to help you monitor your servers and websites automatically.
For installation, read our article – Install PHP Server Monitoring Tool in Linux
11. Linux Dash – Linux Server Performance Monitoring
From its name, “Linux Dash” is a web dashboard that shows you the most important information about your Linux systems such as RAM, CPU, file system, running processes, users, and bandwidth usage in real-time, it has a nice GUI and it’s free & open-source.
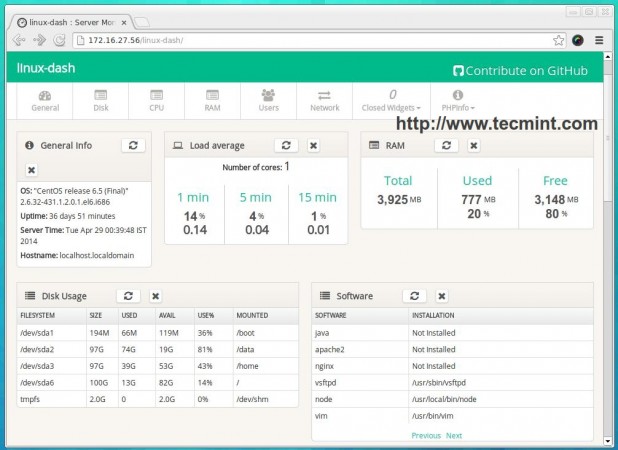
For installation, read our article – Install Linux Dash (Linux Performance Monitoring) Tool in Linux
12. Cacti – Network and System Monitoring
Cacti is nothing more than a free & open-source web interface for RRDtool, it is used often to monitor the bandwidth using SNMP (Simple Network Management Protocol), and it can be used also to monitor CPU usage.
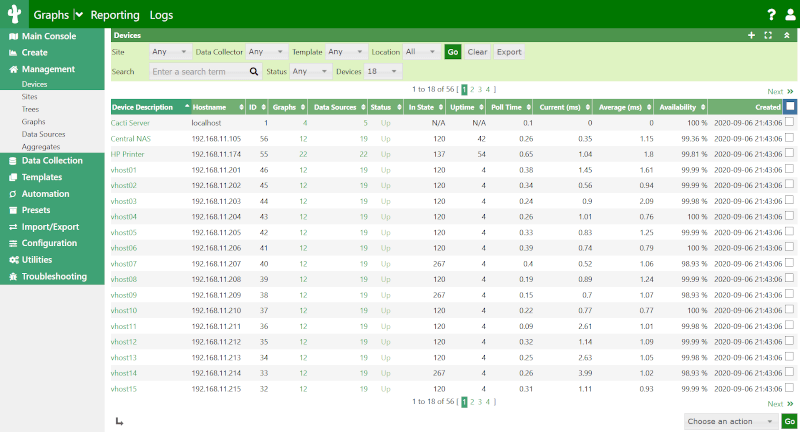
For installation, read our article – Install Cacti Network and System Monitoring Tool in Linux
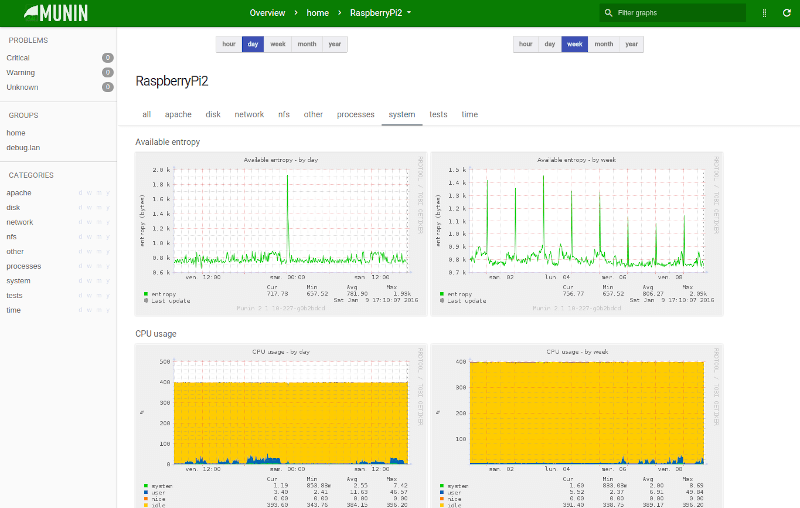
13. Munin – Network Monitoring
Munin is also a web interface GUI for RRDtool, it was written in Perl and licensed under GPL, Munin is a good tool to monitor systems, networks, applications, and services.
It works on all Unix-like operating systems and has a nice plugin system; there are 500+ different plugins available to monitor anything you want on your machine. A notifications system is available to send messages to the administrator when there’s an error or when the error is resolved.
For installation, read our article – Install Munin Network Monitoring Tool in Linux
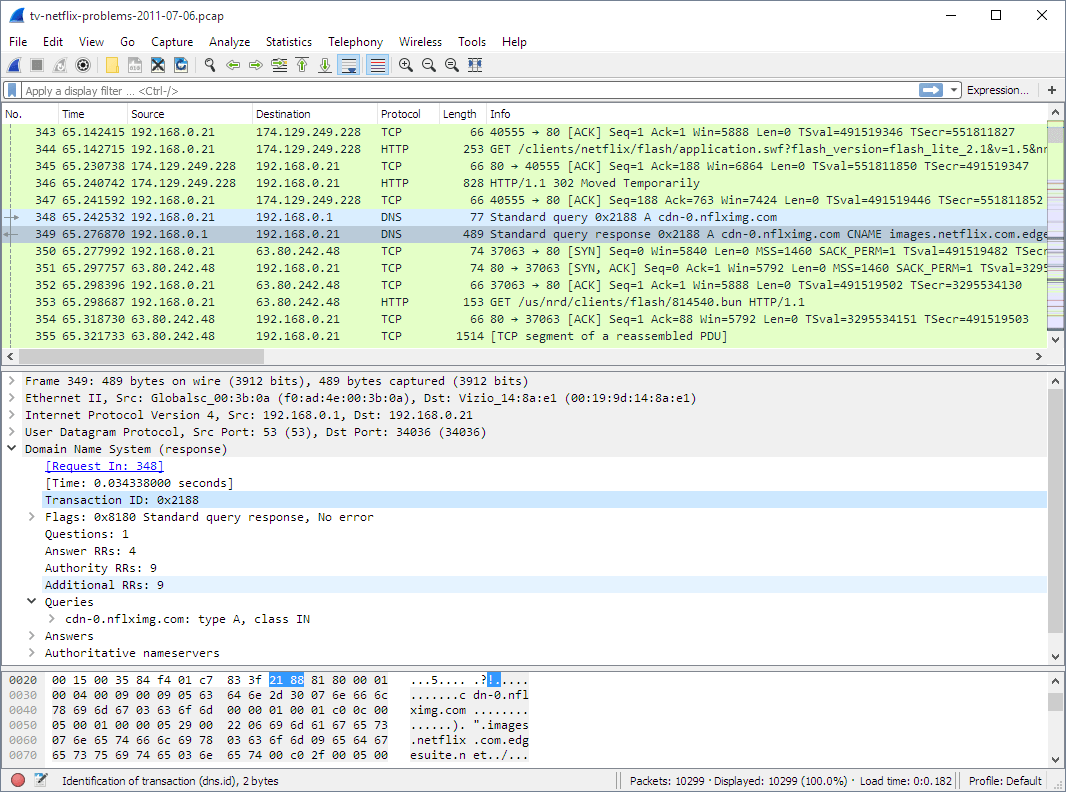
14. Wireshark – Network Protocol Analyzer
Also, unlike all the other tools on our list, Wireshark is an analyzer desktop program that is used to analyze network packets and monitor network connections. It’s written in C with the GTK+ library and released under the GPL license.
Features
- Cross-platform: it works on Linux, BSD, Mac OS X, and Windows.
- Command-line support: there’s a command-line-based version from Wireshark to analyze data.
- Ability to capture VoIP calls, USB traffic, and network data easily to analyze it.
- Available in most Linux distribution repositories.
For installation, read our article – Install Wireshark – Network Protocol Analyzer Tool in Linux
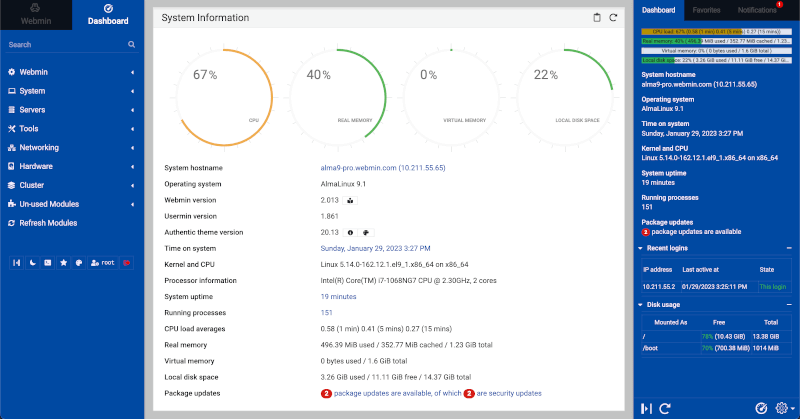
15. Webmin
Webmin is an open-source web-based system and network administration tool (control panel) for Unix-like systems.
Webmin enables you to configure your system internals such as users, services, configuration files, and disk quotes, and manage applications such as Apache, PHP, MySQL and BIND.
Conclusion
These were the most important tools to monitor your Linux/Unix machines, of course, there are many other tools, but these are the most famous. Share your thoughts with us in the comments: What tools & programs do you use to monitor your systems? Have you used any of the tools on this list? What do you think about them?


We have used Munin in the past and it was good. Some elements were a bit complicated. We searched for alternatives and two newer, very simple and comprehensive tools to check out is uptrends and cloudradar (current user).
A good one.
One more suggestion you might want to consider for monitoring tools is AgentlessMonitor from AppPerfect which covers most of the aspects of monitoring like JAVA / J2EE application monitoring, server monitoring, database monitoring, transaction monitoring, network monitoring, log monitoring and system monitoring and last, but not the least is available for free.
Not only do we provide the product, they also provide you the option to have it custom made for you keeping in mind your needs and cost constraints.
It is very easy to use and generates automated alerts in case of exceeding limits or rules violation and also needs no bulky agent to be installed.
@Steve Yes, this tool is great. I have used it for monitoring databases and it worked out of the box. It’s very easy to work on this. Here is the link for agentless monitor http://www.appperfect.com/products/agentless-monitor.php
I think SeaLion (https://sealion.com/) is worth a mention here. It’s not as popular as Nagios or Zabbix but is a very powerful tool. I currently use this tool to keep an eye on my servers and it’s very impressive.
It’s very simple to install and use, has a neat and clean UI. It also lets you add your own commands and has a feature to get all the updates in a single mail as a daily digest.
Again a great article !!
Thanks,
Also I am looking forward for an article related with some specific Opensource tools/softwares to analyse Apache Error and Access logs
More better will be to know a Open Source tool to analyse MySQL logs in realtime i.e. If someone have Webfrontend based on a Customer Java program but uses MySQL for most of the operations then a tool which can show which MySQL query was executed during an operation performed by the end user
You can try Agentless Monitor to monitor your logs in real time.
How about monitoring tool for SAMBA, GUI to know who touch or edit the file in fileserver? thanks for those who want to reply
@Bienlac,
Do you have any monitoring tool for samba in your mind? Please tell us so that we can write a detailed artilce on the requested topic..
A great list, but i think that I can add one more tool to the list. This tool is Anturis and it is a cloud-based tool with all in one character and which can monitor the whole company IT infrastructure and all kinds of servers at the same time. This is an agent tool which checks all the essential metrics like CPU, Memory, Disk, Swap and Network Interface usage, OS Processes etc.
There’s also Monitorix which is easy to setup and can graph a lot of things. Very useful.
Oh it’s in part 1 :) sorry
@Gunner,
Yes, Monitorix tool show you more in depth graphs about your system, here is the guide to install and setup..
https://www.tecmint.com/monitorix-a-lightweight-system-and-network-monitoring-tool-for-linux/
Thanks a lot bro very useful, i appreciate you for posting this.i am waiting for next article.