We recently showed how to install MongoDB in Ubuntu 18.04. Once you have successfully deployed your database, you need to monitor its performance while it is running. This is one of the most important tasks under database administration.
Luckily enough, MongoDB provides various methods for retrieving its performance and activity. In this article, we will look at monitoring utilities and database commands for reporting statistics about the state of a running MongoDB instance.
1. Mongostat
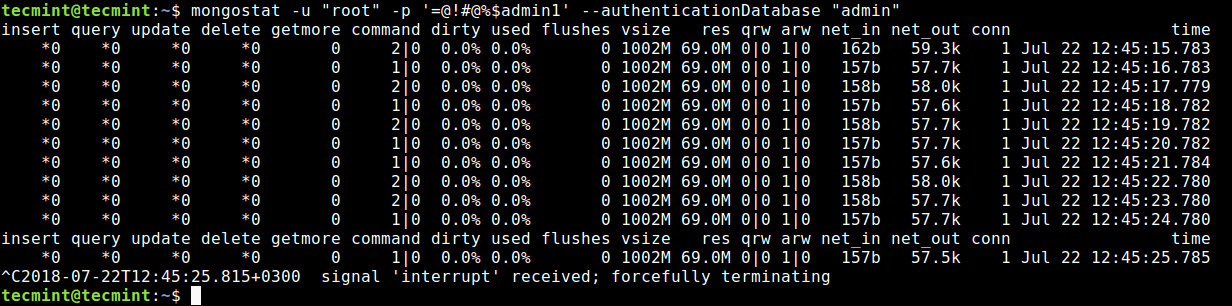
Mongostat is similar in functionality to vmstat monitoring tool, which is available on all major Unix-like operating systems such as Linux, FreeBSD, Solaris as well as MacOS. Mongostat is used to get a quick overview of the status of your database; it provides a dynamic real-time view of a running mongod or mongos instance. It retrieves the counts of database operations by type, such as insert, query, update, delete and more.
You can run mongostat as shown. Note that if you have authentication enabled, put the user password in single quotes to avoid getting an error, especially if you have special characters in it.
$ mongostat -u "root" -p '=@!#@%$admin1' --authenticationDatabase "admin"
For more mongostat usage options, type the following command.
$ mongostat --help
2. Mongotop
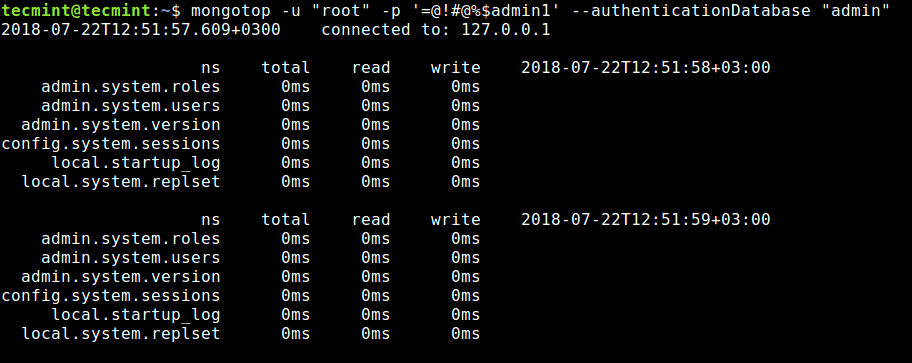
Mongotop also provides a dynamic real-time view of a running MongoDB instance. It tracks the amount of time a MongoDB instance spends reading and writing data. It returns values every second, by default.
$ mongotop -u "root" -p '=@!#@%$admin1' --authenticationDatabase "admin"
For more mongotop usage options, type the following command.
$ mongotop --help
3. serverStatus Command
First, you need to run the following command to login into mongo shell.
$ mongo -u "root" -p '=@!#@%$admin1' --authenticationDatabase "admin"
Then run the serverStatus command, which provides an overview of the database’s state, by collecting statistics about the instance.
>db.runCommand( { serverStatus: 1 } )
OR
>db.serverStatus()
4. dbStats Command
The dbStats command returns storage statistics for a particular database, such as the amount of storage used, the quantity of data contained in the database, and object, collection, and index counters.
>db.runCommand({ dbStats: 1 } )
OR
>db.stats()
5. collStats
collStats command is used to collect statistics similar to that provided by dbStats on the collection level, but its output includes a count of the objects in the collection, the size of the collection, the amount of disk space consumed by the collection, and information concerning its indexes.
>db.runCommand( { collStats : "aurthors", scale: 1024 } )
6. replSetGetStatus Command
The replSetGetStatus command outputs the status of the replica set from the perspective of the server that processed the command. This command must be run against the admin database in the followiing form.
>db.adminCommand( { replSetGetStatus : 1 } )
In this addition to the above utilities and database commands, you can also use supported third party monitoring tools either directly, or via their own plugins. These include mtop, munin and nagios.
For more information, consult: Monitoring for MongoDB Documentation.
That’s it for now! In this article, we have covered some useful monitoring utilities and database commands for reporting statistics about the state of a running MongoDB instance. Use the feedback form below to ask any questions or share your thoughts with us.


Hi, I run the command “
db.stats( )“, here I got the following details:Which is the Unit of dataSize, avgObjSize and storageSize ?