Netdata is a free and opensource real-time monitoring and troubleshooting tool for cloud servers, containers, applications, and on-premise IT infrastructure. It provides high granular and real-time system metrics such as CPU performance, RAM & disk utilization, and bandwidth statistics, to mention a few.
Additionally, Netdata also provides interactive metric visualizations that can be accessed on a web browser along with intelligent alarms that help in troubleshooting system faults.
Netdata’s cutting edge technology and popularity have earned it a place in Forbes cloud 100 rising stars in 2020, which is no mean feat. In fact, at the time of writing this guide, it has received almost 50,000 Github stars.
There are two ways that you can use to install Netdata. You can right away run an automated script on a BASH shell. This updates your systems and initiates the installation of Netdata, Alternatively, you can clone Netdata’s Git repository and thereafter execute the automated script. The first method is simple and straightforward and it is what we shall focus on in this guide.
In this article, we will see how you can install Netdata on Ubuntu to monitor real-time, performance, and health monitoring of servers and applications.
Supported Platforms
Netdata supports the following Ubuntu LTS distributions:
- Ubuntu 20.04
- Ubuntu 18.04
- Ubuntu 16.04
How to Install Netdata in Ubuntu Linux
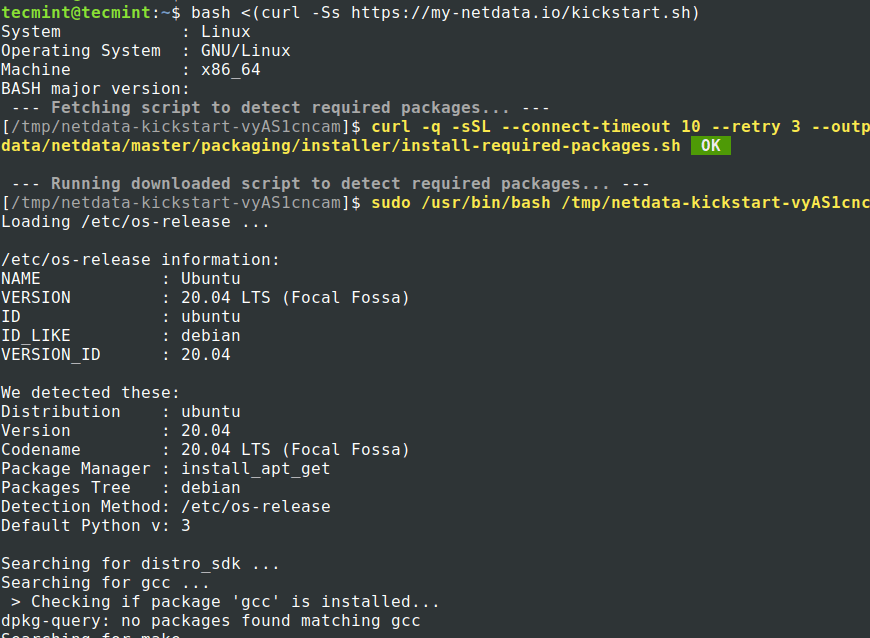
To begin the installation, run the command below on your bash terminal to download and execute the script.
$ bash <(curl -Ss https://my-netdata.io/kickstart.sh)
During the execution of the script, the following takes place:
- The script automatically discovers your Linux distribution, updates the package list, and installs all the requisite software packages.
- The latest netdata source tree is downloaded to the /usr/src/netdata.git path.
- The script installs netdata by running the ./netdata-installer.sh script from the source tree.
- An update is made to cron.daily to ensure that netdata is updated on a daily basis.
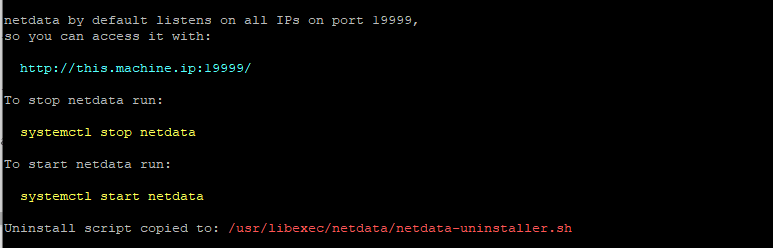
As the script is run, you will be given tips on how to access Netdata on a browser and how to manage it as a systemd service.
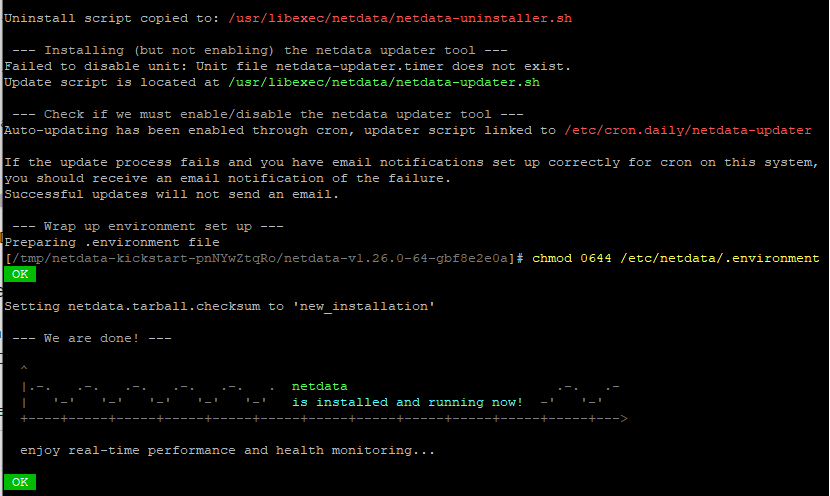
The installation takes a while, so give it about 10 minutes and come back. Finally, you’ll get the output below as the script wraps up the installation.
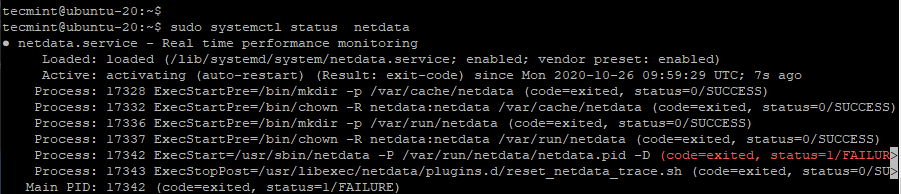
Once installed, start, enable, and verify the status of Netdata as shown.
$ sudo systemctl start netdata
$ sudo systemctl enable netdata
$ sudo systemctl status netdata
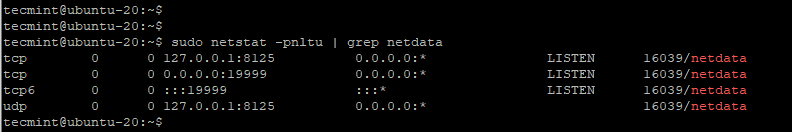
By default, Netdata listens on port 19999 and this can be confirmed using the netstat command as shown.
$ sudo netstat -pnltu | grep netdata
If you have UFW running, make an effort to open port 19999 as this will be required when accessing Netdata on the browser.
$ sudo ufw allow 19999/tcp
$ sudo ufw reload
Finally, to access Netdata, switch to your browser and browse the following URL
http://server-ip:19999/
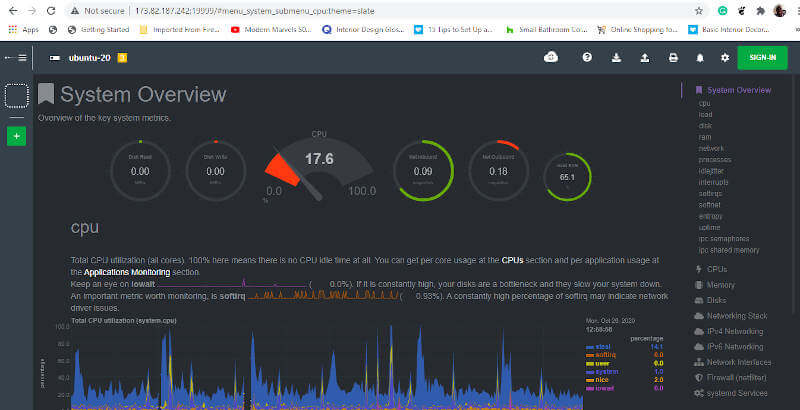
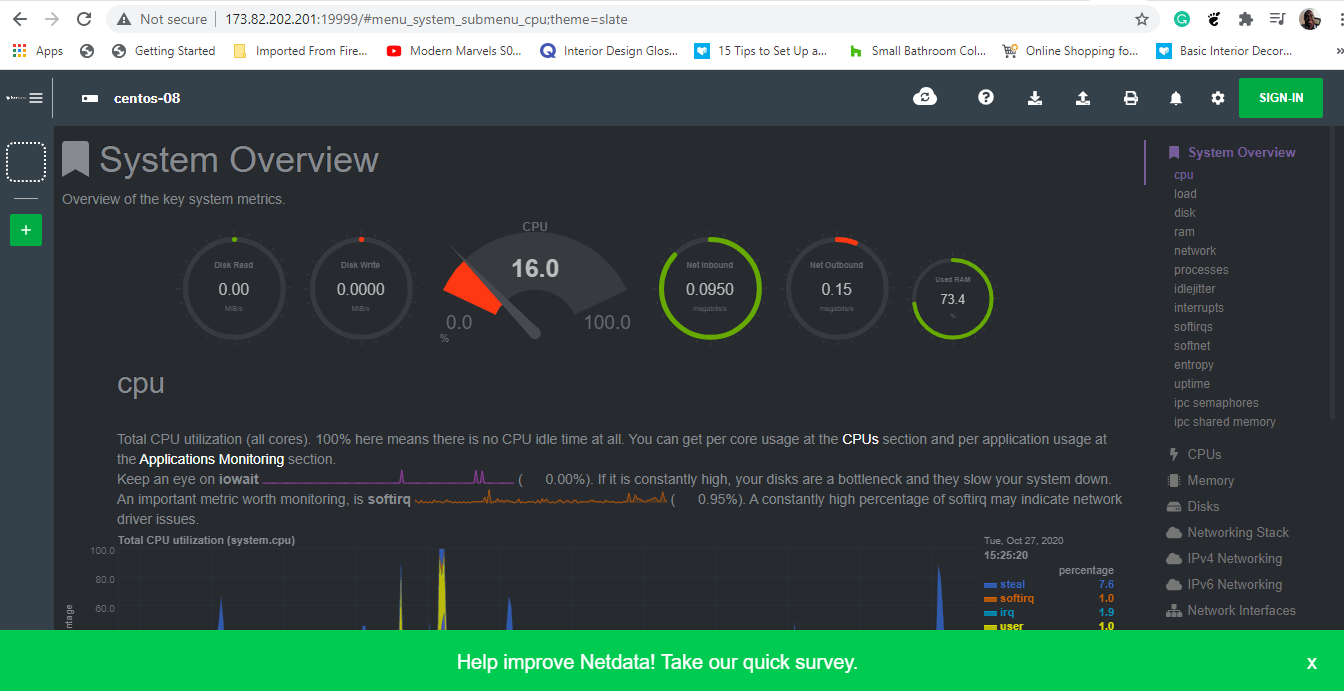
This is what greets you once you browse the URL. In fact, you’ll realize that you won’t be required to login in. All the system’s metrics will be displayed as shown.
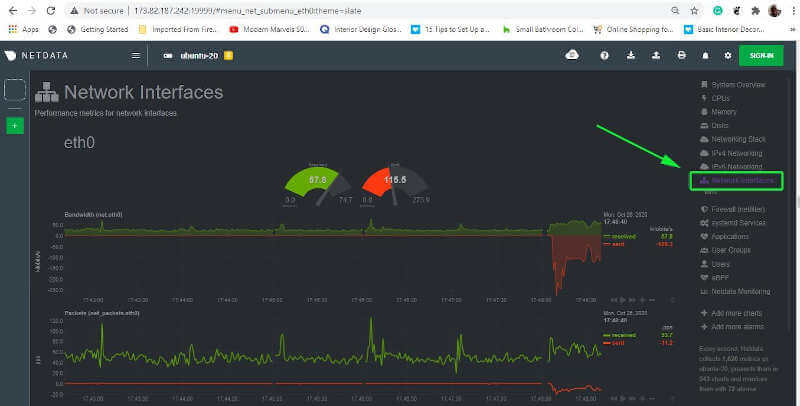
You can flip through various graphs by clicking on your preferred metrics on the right sidebar of the dashboard. For example, to check out the network interface statistics, click on the ‘Network Interfaces‘ option.
Securing Netdata with Basic Authentication on Ubuntu
Up until this point, anyone can access the Netdata dashboard and have a peek at the various system metrics. This amounts to a security breach and we definitely want to avoid this.
With this in mind, we are going to configure basic HTTP authentication. We need to install the apache2-utils package that provides the htpasswd program which will be used to configure the username and password of the user. Additionally, we will install the Nginx web server will act as the reverse proxy.
To install the Nginx web server and apache2-utils package execute the command.
$ sudo apt install nginx apache2-utils
With Nginx and apache2-utils installed, we are going to create a configuration file inside the /etc/nginx/conf.d directory. However, feel free to use the sites-available directory if you are using Nginx for other purposes aside from Netdata.
$ sudo vim /etc/nginx/conf.d/default.conf
Inside the configuration file, we will first instruct Nginx to proxy incoming requests for the Netdata dashboard. Thereafter we will append some basic authentication prompt that only grants authorized users access to the Netdata dashboard using username/password authentication.
Here’s the entire configuration. Be mindful to replace the server_ip and example.com directives with your own server IP address and server name.
upstream netdata-backend {
    server 127.0.0.1:19999;
    keepalive 64;
}

server {
    listen server_ip:80;
    server_name example.com;

    auth_basic "Authentication Required";
    auth_basic_user_file netdata-access;

    location / {
        proxy_set_header X-Forwarded-Host $host;
        proxy_set_header X-Forwarded-Server $host;
        proxy_set_header X-Forwarded-For $proxy_add_x_forwarded_for;
        proxy_pass http://netdata-backend;
        proxy_http_version 1.1;
        proxy_pass_request_headers on;
        proxy_set_header Connection "keep-alive";
        proxy_store off;
    }
}
Let’s understand the configuration, section by section.
Section 1:
upstream netdata-backend {
    server 127.0.0.1:19999;
    keepalive 64;
}
We have specified an upstream module called netdata-backend that references Netdata’s built-in web server using the loopback address 127.0.0.1 and port 19999 which is the default port that Netdata listens on. The keepalive directive defines the maximum number of idle connections that can remain open.
Section 2:
server {
    listen server_ip:80;
    server_name example.com;

    auth_basic "Authentication Required";
    auth_basic_user_file netdata-access;
This is the main Nginx server block section. The first line specifies the external IP address that Nginx should listen for when clients send their requests. The server_name directive specifies the domain name of the server and instructs Nginx to run the server block when the clients invoke the domain name instead of the external IP address.
The last two lines indicate the simple HTTP authentication that requires the user to sign in using a username and password. The auth_basic module triggers the username/password pop-up on the browser with the “Authentication Required” on the title which can later be customized to suit your preference.
The auth_basic_user_file module points to the file name that will contain the username and password of the user authorized to access Netdata’s dashboard – In this case netdata-access. We will create this file later on.
Section 3:
The last section is the location block which is contained within the server block. This handles the proxying and forwarding of incoming requests to the Nginx web server.
location / {
        proxy_set_header X-Forwarded-Host $host;
        proxy_set_header X-Forwarded-Server $host;
        proxy_set_header X-Forwarded-For $proxy_add_x_forwarded_for;
        proxy_pass http://netdata-backend;
        proxy_http_version 1.1;
        proxy_pass_request_headers on;
        proxy_set_header Connection "keep-alive";
        proxy_store off;
    }
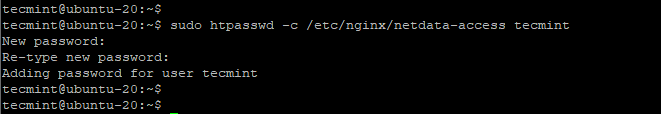
For authentication, we will create a username and password for a user called tecmint using the htpasswd utility and store the credentials inside the netdata-access file.
$ sudo htpasswd -c /etc/nginx/netdata-access tecmint
Provide the password and confirm it.
Next, restart the Nginx web server for the changes to come into effect.
$ sudo systemctl restart nginx
To test if the configuration went right, proceed and browse your server’s IP address
http://server-ip
An authentication pop-up will appear as shown below. Provide your username and password and hit ENTER.
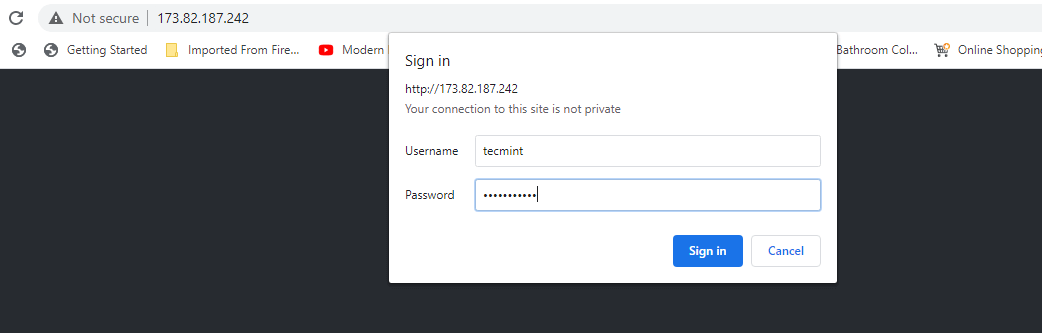
Thereafter, you will get access to the Netdata dashboard.
This brings us to the end of our topic for today. You’ve just learned how to install the Netdata monitoring tool and configuration of basic HTTP authentication on Ubuntu. Feel free to check out other graphs on various system metrics.


How to use the config in apache?