In our previous articles, we have covered the basics of ls command and cat command. In this article, we are trying to explore the top command which is one of the most frequently used commands in our daily system administrative jobs.
The top command (table of processes) displays the processor activity of your Linux box and also displays tasks managed by the kernel in real-time. It also shows information about CPU and memory utilization of a list of running processes.
You might also be interested in the following tutorials :
- Htop – An Interactive Process Viewer for Linux
- Iotop – Monitor Linux Disk I/O Activity and Usage Per-Process Basis
- bmon – A Powerful Network Bandwidth Monitoring for Linux
- Find Top 15 Processes by Memory Usage in Linux
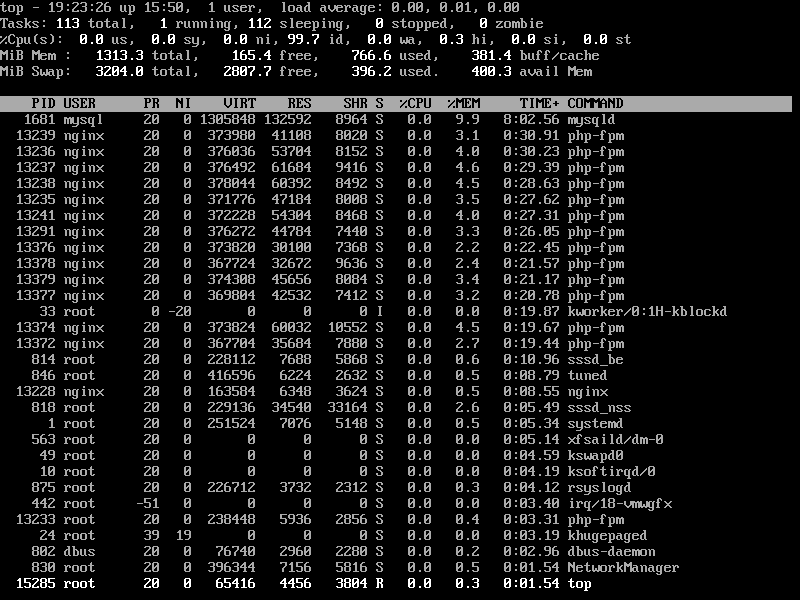
1. List All Running Linux Processes
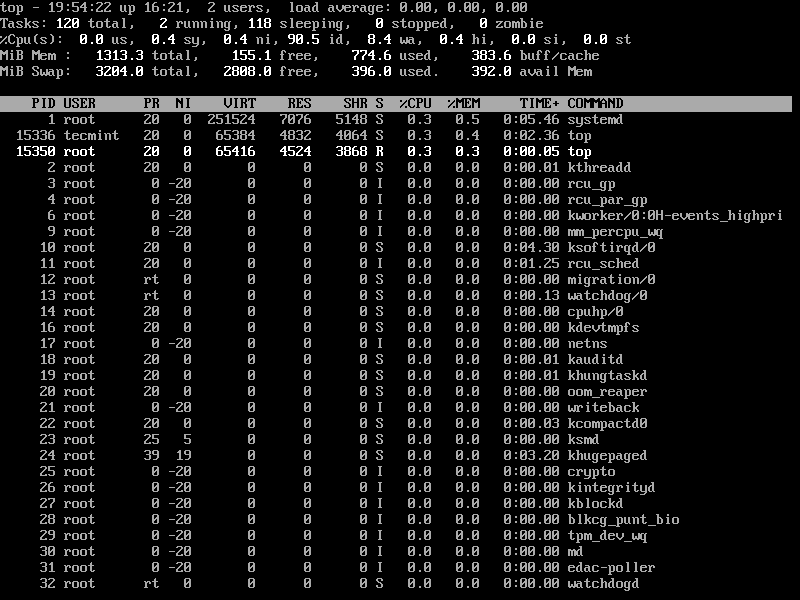
To list all running Linux Processes, simply type top on the command line to get the information of running tasks, memory, cpu, and swap. Press ‘q‘ to quit window.
# top

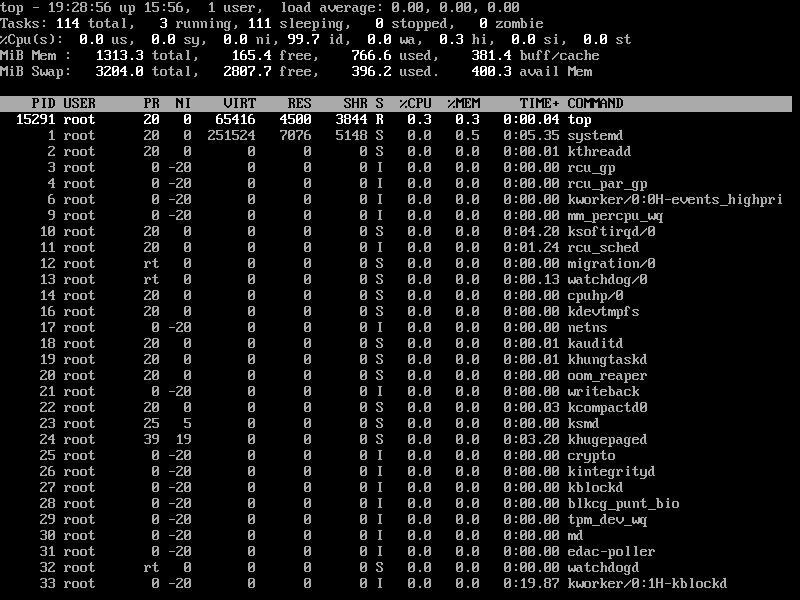
2. Sort Linux Processes by PID
To sort all Linux running processes by Process ID, press M and T keys.
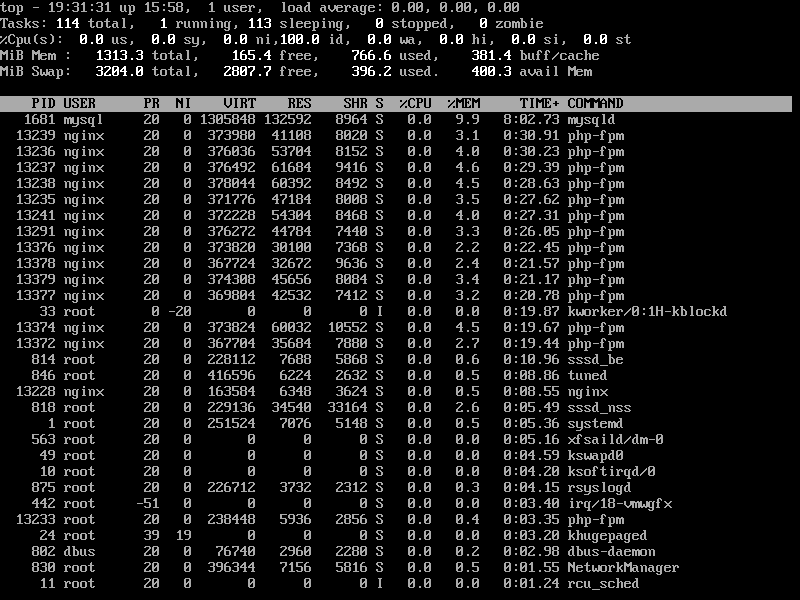
3. Sort Linux Processes by Memory and CPU Usage
To sort all Linux running processes by Memory usage, press M and P keys.
4. Sort Linux Processes by Running Time
To sort all Linux running processes by running time, press M and T keys.
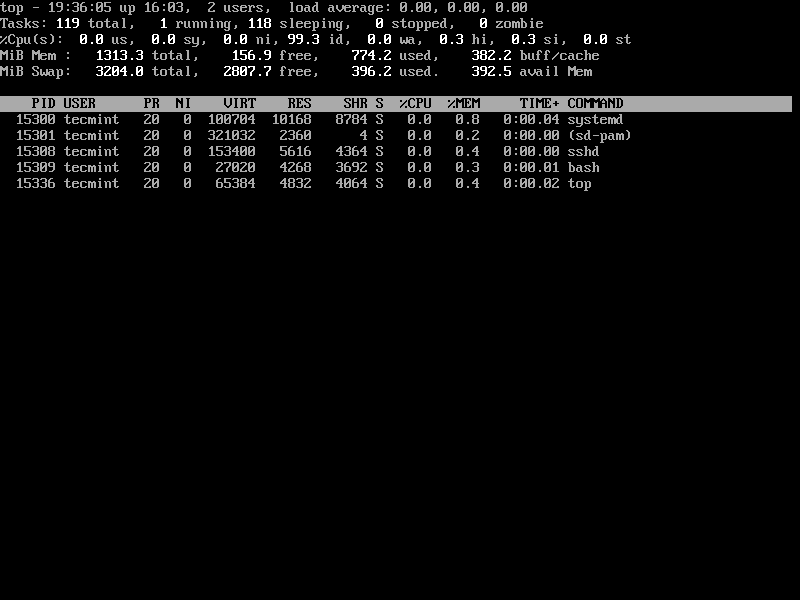
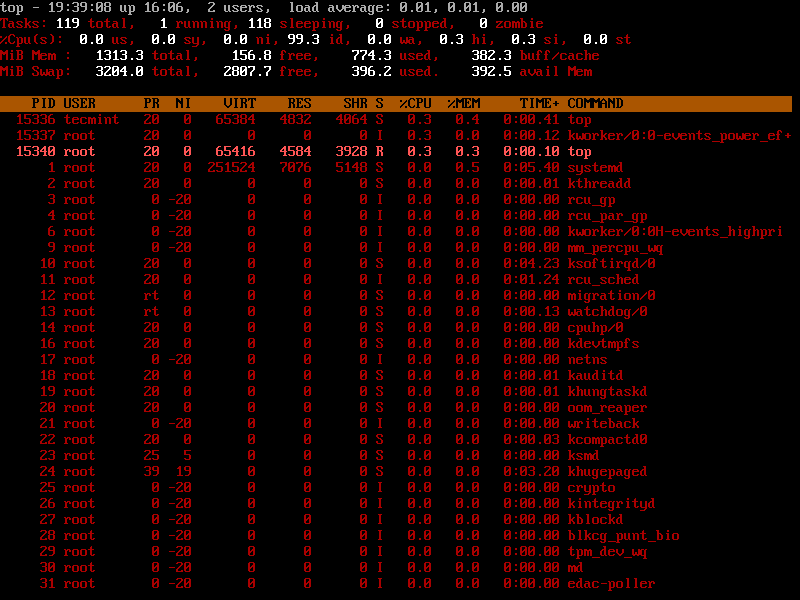
5. Display Linux Processes By Specific User
To display all user-specific running processes information, use the -u option will list specific User process details.
# top -u tecmint
6. Highlight Running Process in Top
Press ‘z‘ option will display the running process in color which may help you to identify the running process easily.
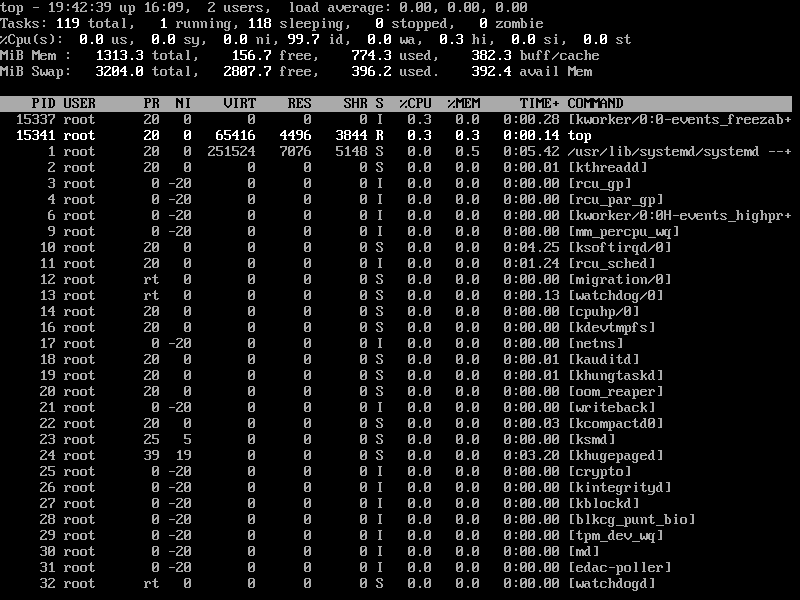
7. List Absolute Path of Running Linux Processes
Press ‘c‘ option in running top command will display the absolute path of the running process.
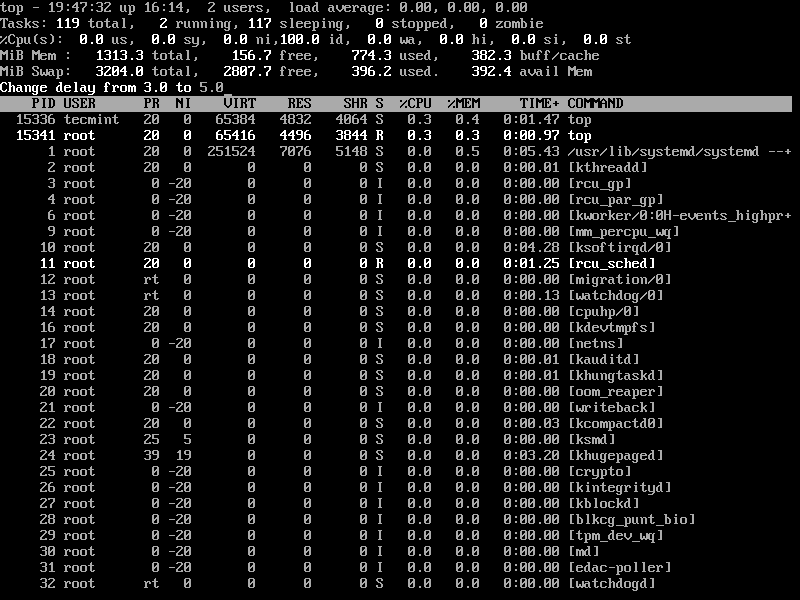
8. Set Refresh Interval for Top Command
By default screen refresh interval is set to 3.0 seconds, the same can be changed by pressing the ‘d‘ option in running the top command to set desired interval time.
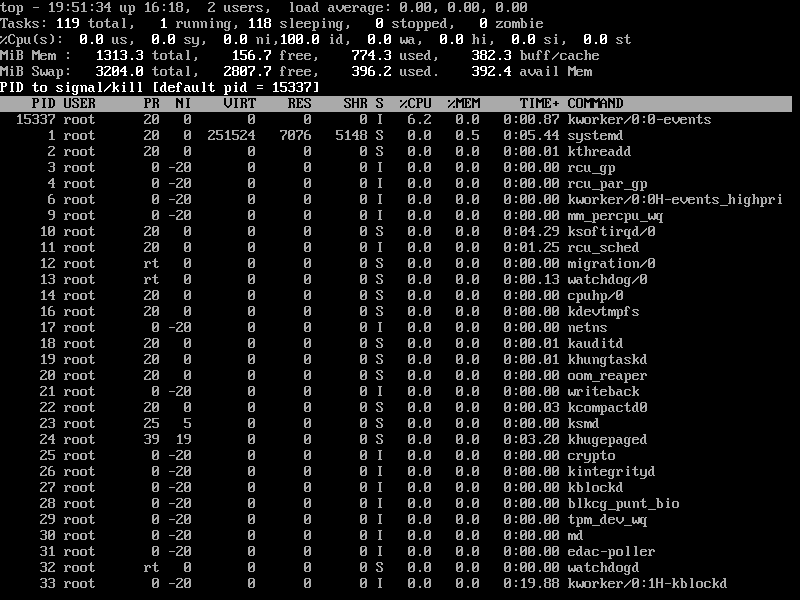
9. Kill Running Linux Process Using Top Command
You can kill a process after finding the PID of the process by pressing the ‘k‘ option in running the top command without closing the top window as shown below.
10. Sort Linux Processes by CPU Utilisation
To sort all running processes by CPU utilization, simply press Shift+P key.
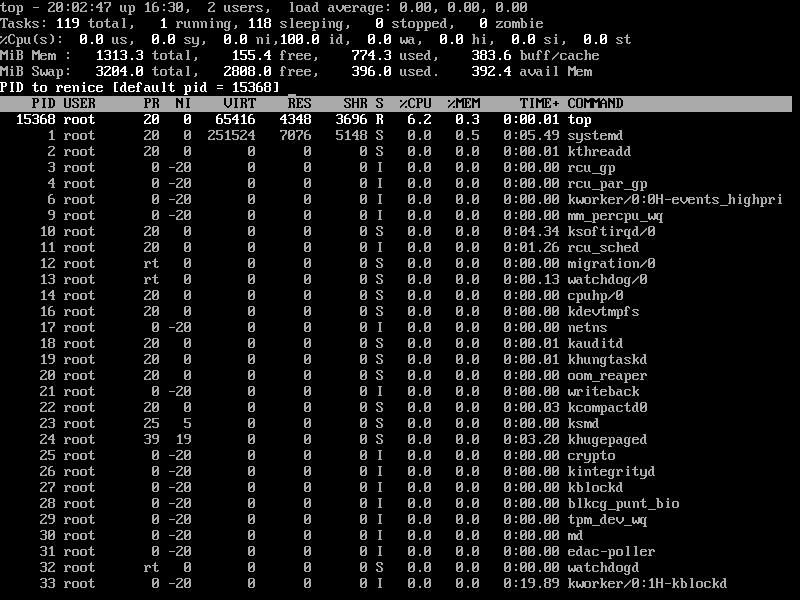
11. Renice a Linux Process
You can use the ‘r‘ option to change the priority of the process also called Renice.
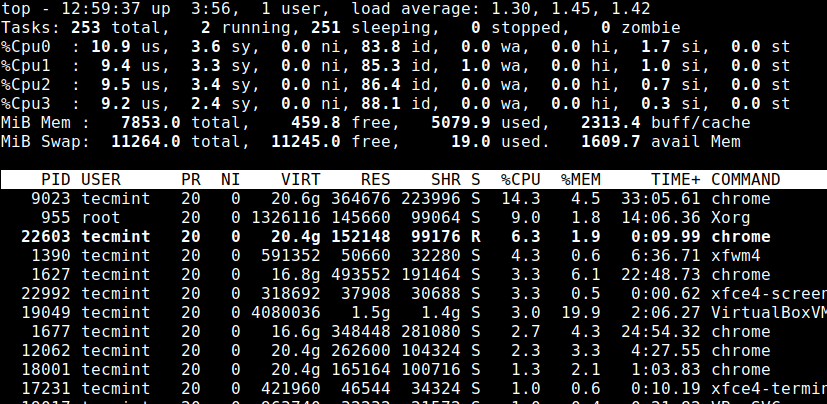
12. Check Linux CPU Cores
To list the load information of your CPU cores, simply press 1 to list the CPU core details.
13. Save Top Command Results in File
To save the running top command results output to a file /root/.toprc use the following command.
# top -n 1 -b > top-output.txt
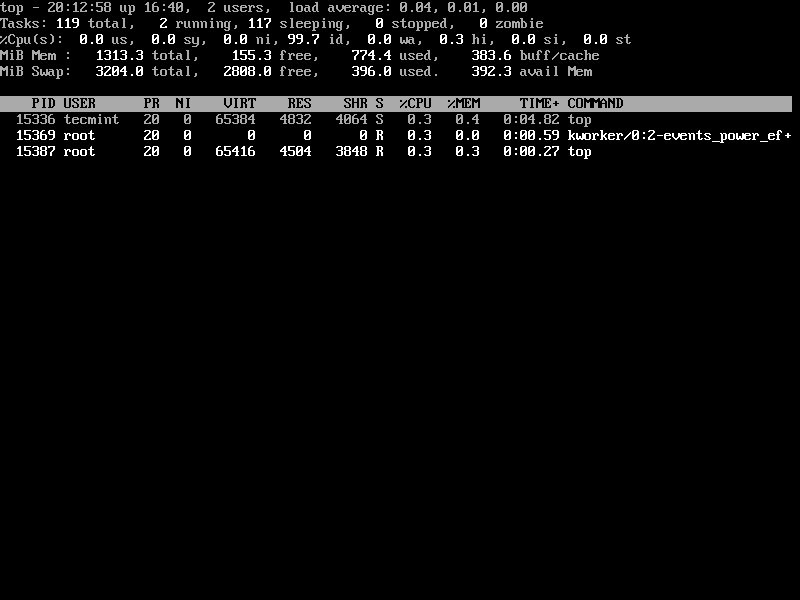
14. List Linux Idle Processes
Press 'i' to get the list of idle/sleeping processes.
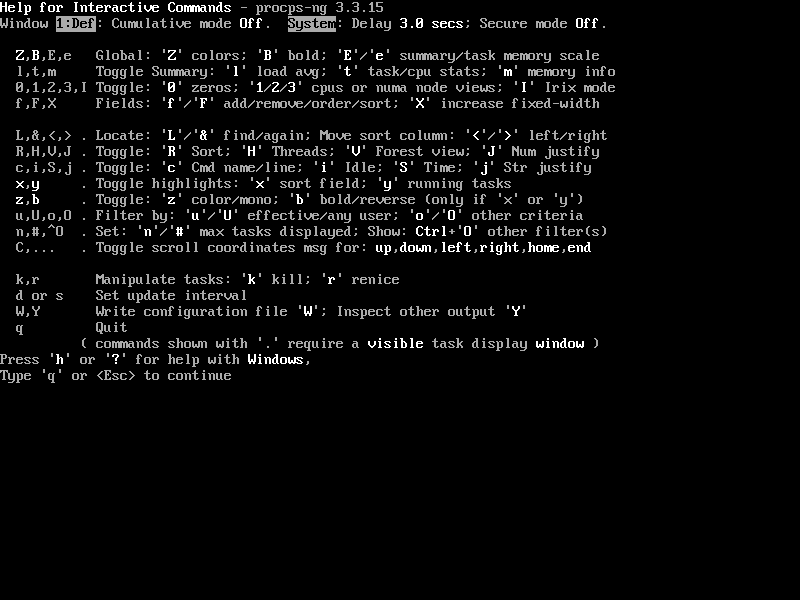
15. Getting Top Command Help
Press the ‘h‘ option to obtain the top command help.
16. Exit Top Command After Specific Repetition
The output of the top command keeps refreshing until you press ‘q‘. With the below command, it will automatically exit after 10 repetitions.
# top -n 10
There is a number of arguments to know more about the top command, you may refer man page of the top command. Please share it if you find this article useful or share your thoughts using our comment box below.