Being a System or Network administrator tasked with monitoring and debugging Linux system performance problems on a daily basis is an immensely challenging responsibility.
It demands unwavering dedication, a profound understanding of Linux systems, and a constant commitment to ensuring optimal performance and reliability.
After dedicating a decade to working as a Linux Administrator in the IT industry, I have come to truly appreciate the arduous task of monitoring and ensuring the continuous operation of systems.
In light of this, we have curated a comprehensive list of the Top 20 frequently used command-line monitoring tools. These invaluable tools can prove indispensable for every Linux/Unix System Administrator, empowering them to efficiently monitor, diagnose, and maintain the health and performance of their systems.
These monitoring tools are available under all flavors of Linux and can be useful to monitor and find the actual causes of performance problems. This list of commands shown here is very enough for you to pick the one that is suitable for your monitoring scenario.
1. Top – Linux Process Monitoring
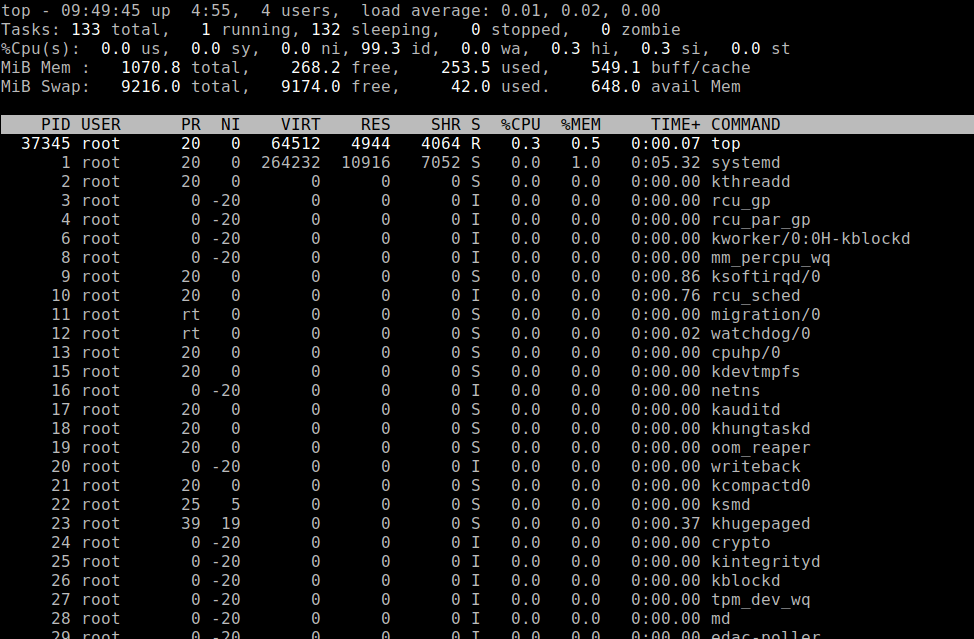
Linux top command is a performance monitoring program that is used frequently by many system administrators to monitor Linux performance and it is available under many Linux/Unix-like operating systems.
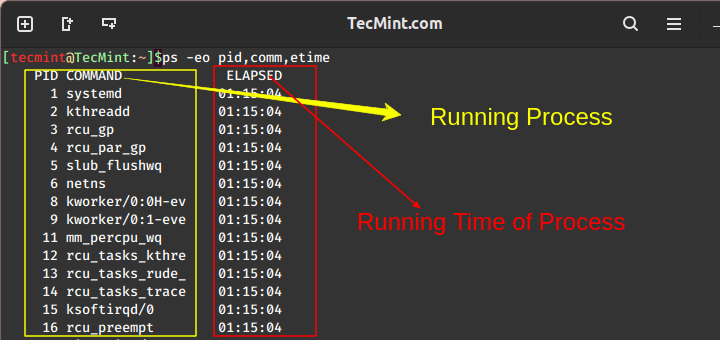
The top command is used to display all the running and active real-time processes in an ordered list and updates it regularly. It displays CPU usage, Memory usage, Swap Memory, Cache Size, Buffer Size, Process PID, User, Commands, and much more.
It also shows high memory and cpu utilization of running processes. The top command is much useful for system administrators to monitor and take corrective action when required. Let’s see the top command in action.
# top
2. VmStat – Virtual Memory Statistics
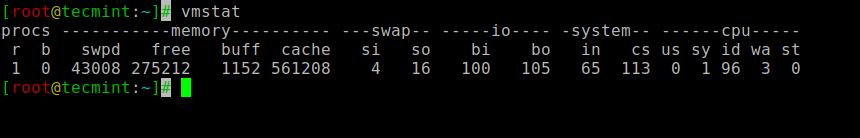
Linux VmStat command is used to display statistics of virtual memory, kernel threads, disks, system processes, I/O blocks, interrupts, CPU activity, and much more.
Install VmStat on Linux
By default vmstat command is not available under Linux systems you need to install a package called sysstat (a powerful monitoring tool) that includes a vmstat program.
$ sudo yum install sysstat      [On Older CentOS/RHEL & Fedora]
$ sudo dnf install sysstat      [On CentOS/RHEL/Fedora/Rocky Linux & AlmaLinux]
$ sudo apt-get install sysstat  [On Debian/Ubuntu & Mint]
$ sudo pacman -S sysstat        [On Arch Linux]
The common usage of the vmstat command format is.
# vmstat

procs -----------memory---------- ---swap-- -----io---- -system-- ------cpu-----
 r  b   swpd   free   buff  cache   si   so    bi    bo   in   cs us sy id wa st
 1  0  43008 275212   1152 561208    4   16   100   105   65  113  0  1 96  3  0
3. Lsof – List Open Files
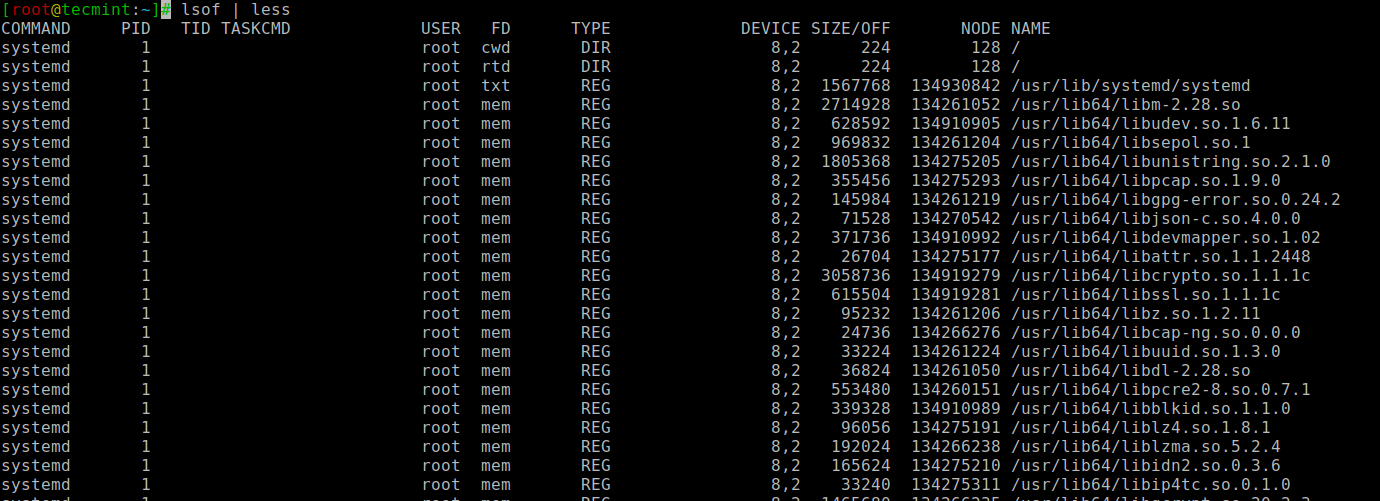
The lsof command is used in many Linux/Unix-like systems to display a list of all the open files and processes. The open files included are disk files, network sockets, pipes, devices, and processes.
One of the main reasons for using this command is when a disk cannot be unmounted and displays the error that files are being used or opened. With this command, you can easily identify which files are in use.
The most common format for lsof command is.
# lsof

COMMAND     PID   TID TASKCMD             USER   FD      TYPE             DEVICE SIZE/OFF       NODE NAME
systemd       1                           root  cwd       DIR                8,2      224        128 /
systemd       1                           root  rtd       DIR                8,2      224        128 /
systemd       1                           root  txt       REG                8,2  1567768  134930842 /usr/lib/systemd/systemd
systemd       1                           root  mem       REG                8,2  2714928  134261052 /usr/lib64/libm-2.28.so
systemd       1                           root  mem       REG                8,2   628592  134910905 /usr/lib64/libudev.so.1.6.11
systemd       1                           root  mem       REG                8,2   969832  134261204 /usr/lib64/libsepol.so.1
systemd       1                           root  mem       REG                8,2  1805368  134275205 /usr/lib64/libunistring.so.2.1.0
systemd       1                           root  mem       REG                8,2   355456  134275293 /usr/lib64/libpcap.so.1.9.0
systemd       1                           root  mem       REG                8,2   145984  134261219 /usr/lib64/libgpg-error.so.0.24.2
systemd       1                           root  mem       REG                8,2    71528  134270542 /usr/lib64/libjson-c.so.4.0.0
systemd       1                           root  mem       REG                8,2   371736  134910992 /usr/lib64/libdevmapper.so.1.02
systemd       1                           root  mem       REG                8,2    26704  134275177 /usr/lib64/libattr.so.1.1.2448
systemd       1                           root  mem       REG                8,2  3058736  134919279 /usr/lib64/libcrypto.so.1.1.1c
...
4. Tcpdump – Network Packet Analyzer
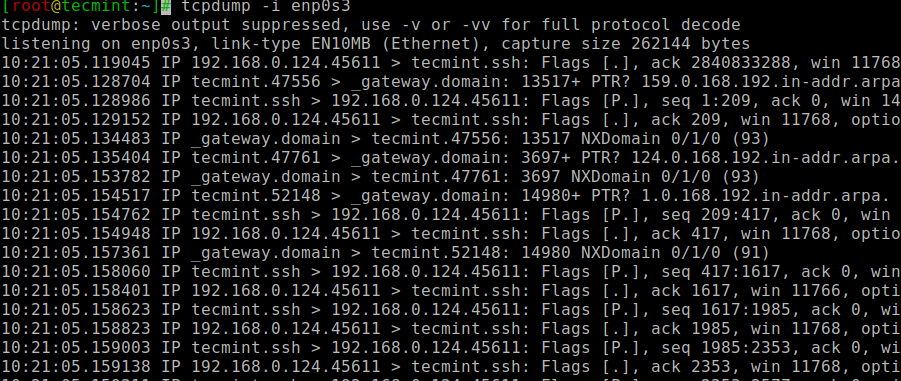
The tcpdump command is one of the most widely used command-line network packet analyzer or packet sniffer programs that is used to capture or filter TCP/IP packets that are received or transferred on a specific interface over a network.
It also provides an option to save captured packages in a file for later analysis. tcpdump is almost available in all major Linux distributions.
# tcpdump -i enp0s3

tcpdump: verbose output suppressed, use -v or -vv for full protocol decode
listening on enp0s3, link-type EN10MB (Ethernet), capture size 262144 bytes
10:19:34.635893 IP tecmint.ssh > 192.168.0.124.45611: Flags [P.], seq 2840044824:2840045032, ack 4007244093
10:19:34.636289 IP 192.168.0.124.45611 > tecmint.ssh: Flags [.], ack 208, win 11768, options
10:19:34.873060 IP _gateway.57682 > tecmint.netbios-ns: NBT UDP PACKET(137): QUERY; REQUEST; UNICAST
10:19:34.873104 IP tecmint > _gateway: ICMP tecmint udp port netbios-ns unreachable, length 86
10:19:34.895453 IP _gateway.48953 > tecmint.netbios-ns: NBT UDP PACKET(137): QUERY; REQUEST; UNICAST
10:19:34.895501 IP tecmint > _gateway: ICMP tecmint udp port netbios-ns unreachable, length 86
10:19:34.992693 IP 142.250.4.189.https > 192.168.0.124.38874: UDP, length 45
10:19:35.010127 IP 192.168.0.124.38874 > 142.250.4.189.https: UDP, length 33
10:19:35.135578 IP _gateway.39383 > 192.168.0.124.netbios-ns: NBT UDP PACKET(137): QUERY; REQUEST; UNICAST
10:19:35.135586 IP 192.168.0.124 > _gateway: ICMP 192.168.0.124 udp port netbios-ns unreachable, length 86
10:19:35.155827 IP _gateway.57429 > 192.168.0.124.netbios-ns: NBT UDP PACKET(137): QUERY; REQUEST; UNICAST
10:19:35.155835 IP 192.168.0.124 > _gateway: ICMP 192.168.0.124 udp port netbios-ns unreachable, length 86
...
5. Netstat – Network Statistics
The netstat is a command-line tool for monitoring incoming and outgoing network packet statistics as well as interface statistics. It is a very useful tool for every system administrator to monitor network performance and troubleshoot network-related problems.
# netstat -a | more

Active Internet connections (servers and established)
Proto Recv-Q Send-Q Local Address           Foreign Address         State
tcp        0      0 0.0.0.0:sunrpc          0.0.0.0:*               LISTEN
tcp        0      0 tecmint:domain          0.0.0.0:*               LISTEN
tcp        0      0 0.0.0.0:ssh             0.0.0.0:*               LISTEN
tcp        0      0 localhost:postgres      0.0.0.0:*               LISTEN
tcp        0      0 tecmint:ssh             192.168.0.124:45611     ESTABLISHED
tcp6       0      0 [::]:sunrpc             [::]:*                  LISTEN
tcp6       0      0 [::]:ssh                [::]:*                  LISTEN
tcp6       0      0 localhost:postgres      [::]:*                  LISTEN
udp        0      0 0.0.0.0:mdns            0.0.0.0:*
udp        0      0 localhost:323           0.0.0.0:*
udp        0      0 tecmint:domain          0.0.0.0:*
udp        0      0 0.0.0.0:bootps          0.0.0.0:*
udp        0      0 tecmint:bootpc          _gateway:bootps         ESTABLISHED
...
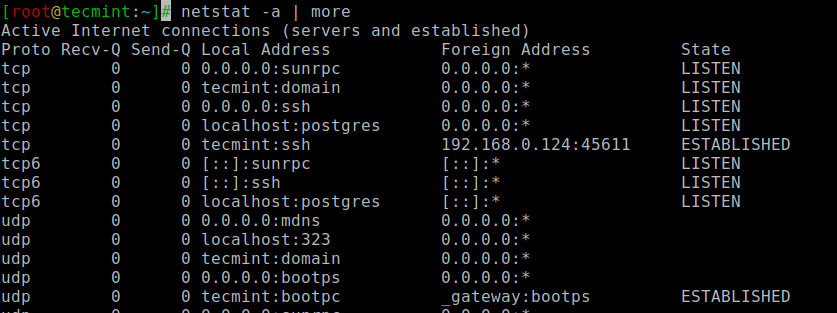
While in present-day netstat has been deprecated in favor of the ss command, you may still discover netstat in your networking toolkit.
6. Htop – Linux Process Monitoring
htop is a much advanced interactive and real-time Linux process monitoring tool, which is much similar to Linux top command but it has some rich features like a user-friendly interface to manage processes, shortcut keys, vertical and horizontal views of the processes, and much more.
# htop
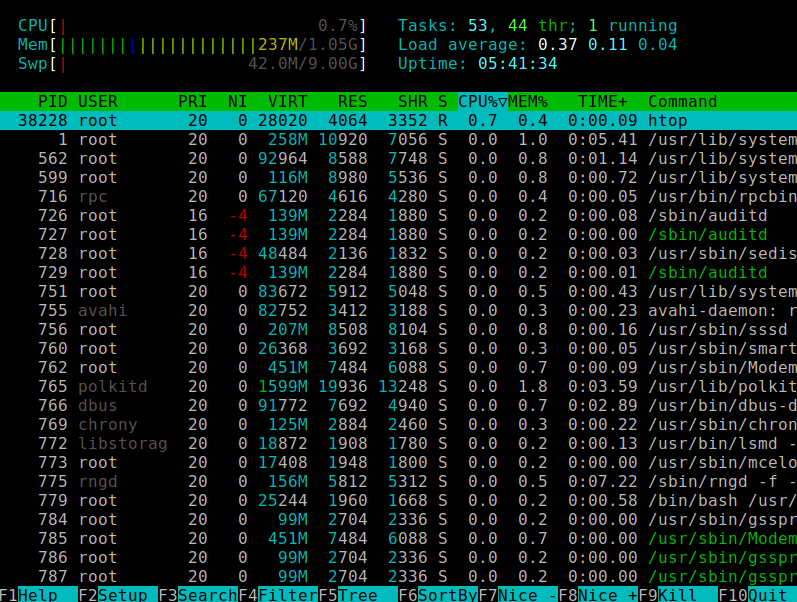
htop is a third-party tool, which doesn’t come with Linux systems, you need to install it using your system package manager tool.
For more information on htop installation read our article – Install Htop (Linux Process Monitoring) in Linux.
7. Iotop – Monitor Linux Disk I/O
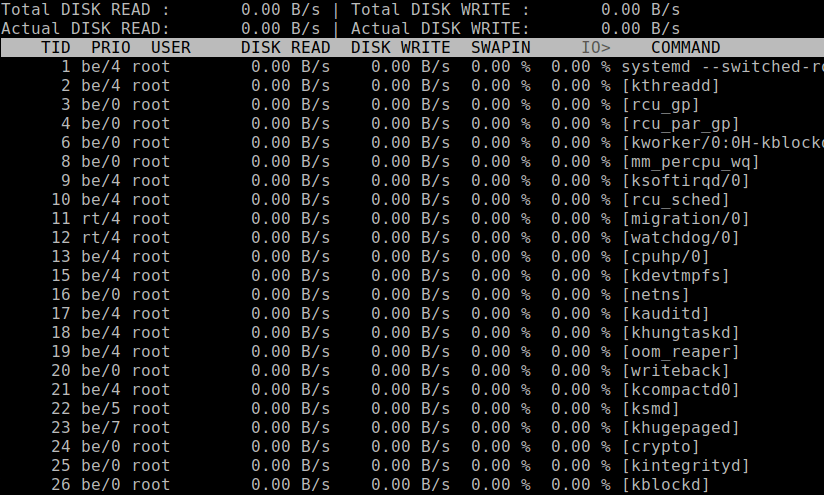
iotop is also much similar to the top command and htop program, but it has an accounting function to monitor and display real-time Disk I/O and processes.
iotop tool is much useful for finding the exact process and highly used disk read/writes of the processes.
Install Iotop on Linux
By default, the iotop command is not available under Linux and you need to install it as shown.
$ sudo yum install iotop      [On Older CentOS/RHEL & Fedora]
$ sudo dnf install iotop      [On CentOS/RHEL/Fedora/Rocky Linux & AlmaLinux]
$ sudo apt-get install iotop  [On Debian/Ubuntu & Mint]
$ sudo pacman -S iotop        [On Arch Linux]
The common usage of the iotop command format is.
# iotop
8. Iostat – Input/Output Statistics
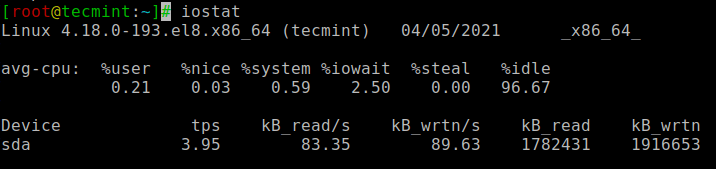
iostat is a simple tool that will collect and show system input and output storage device statistics. This tool is often used to trace storage device performance issues including devices, local disks, and remote disks such as NFS.
Install Iostat on Linux
To get the iostat command, you need to install a package called sysstat as shown.
$ sudo yum install sysstat      [On Older CentOS/RHEL & Fedora]
$ sudo dnf install sysstat      [On CentOS/RHEL/Fedora/Rocky Linux & AlmaLinux]
$ sudo apt-get install sysstat  [On Debian/Ubuntu & Mint]
$ sudo pacman -S sysstat        [On Arch Linux]
The common usage of the iostat command format is.
# iostat

Linux 4.18.0-193.el8.x86_64 (tecmint)   04/05/2021      _x86_64_        (1 CPU)

avg-cpu:  %user   %nice %system %iowait  %steal   %idle
           0.21    0.03    0.59    2.50    0.00   96.67

Device             tps    kB_read/s    kB_wrtn/s    kB_read    kB_wrtn
sda               3.95        83.35        89.63    1782431    1916653
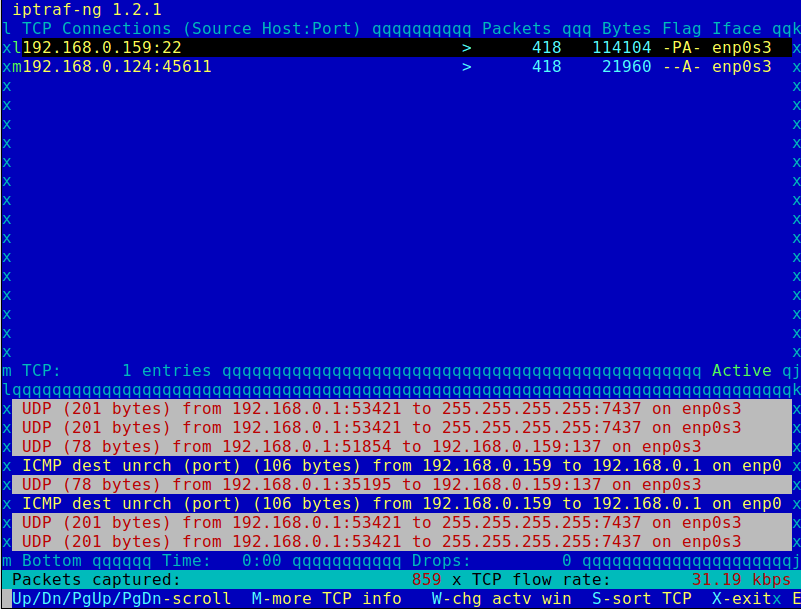
9. IPTraf – Real-Time IP LAN Monitoring
IPTraf is an open-source console-based real-time network (IP LAN) monitoring utility for Linux. It collects a variety of information such as IP traffic monitor that passes over the network, including TCP flag information, ICMP details, TCP/UDP traffic breakdowns, TCP connection packets, and byte counts.
It also gathers information on general and detailed interface statistics of TCP, UDP, IP, ICMP, non-IP, IP checksum errors, interface activity, etc.
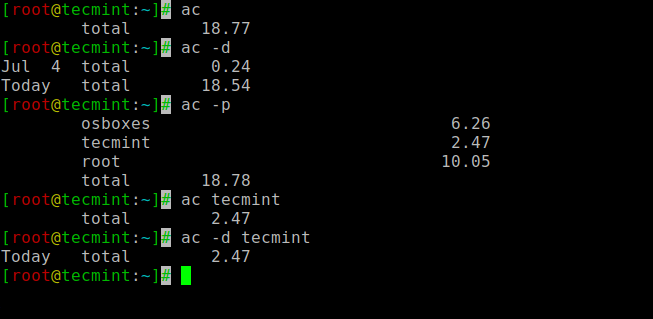
10. Psacct or Acct – Monitor User Activity
psacct or acct tools are very useful for monitoring each user’s activity on the system. Both daemons run in the background and keep a close watch on the overall activity of each user on the system and also what resources are being consumed by them.
These tools are very useful for system administrators to track each user’s activity like what they are doing, what commands they issued, how many resources are used by them, how long they are active on the system etc.
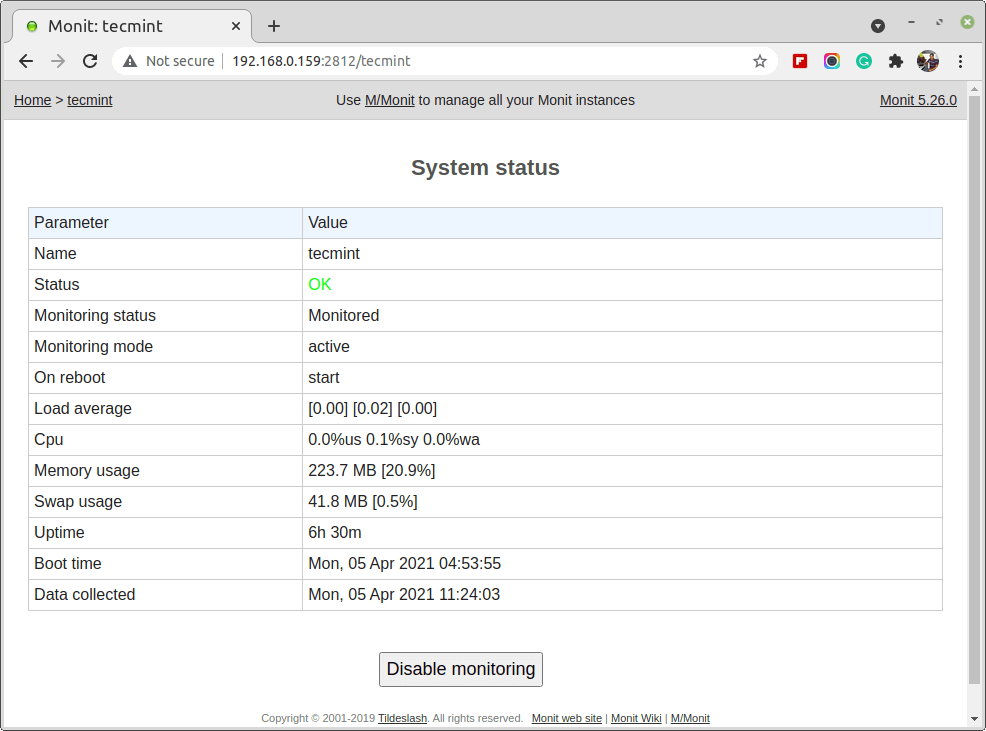
11. Monit – Linux Process and Services Monitoring
Monit is a free open-source and web-based process supervision utility that automatically monitors and manages system processes, programs, files, directories, permissions, checksums, and filesystems.
It monitors services like Apache, MySQL, Mail, FTP, ProFTP, Nginx, SSH, and so on. The system status can be viewed from the command line or using its own web interface.
For installation and configuration, read our article – How to Install and Setup Monit (Linux Process and Services Monitoring) Program.
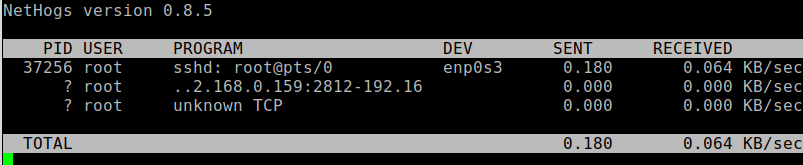
12. NetHogs – Monitor Per Process Network Bandwidth
NetHogs is an open-source nice small program (similar to Linux top command) that keeps a tab on each process network activity on your system. It also keeps track of real-time network traffic bandwidth used by each program or application.
# nethogs
For installation and usage, read our article: Monitor Linux Network Bandwidth Using NetHogs
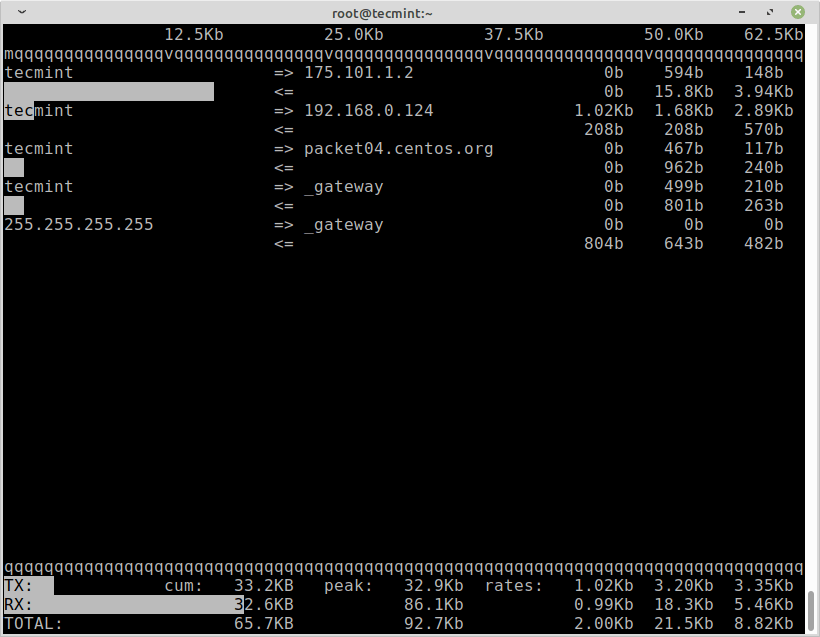
13. iftop – Network Bandwidth Monitoring
iftop is another terminal-based free open source system monitoring utility that displays a frequently updated list of network bandwidth utilization (source and destination hosts) that passes through the network interface on your system.
iftop is analogous to ‘top‘ in the context of network usage, much like how ‘top‘ provides insights into CPU usage.
iftop belongs to the esteemed ‘top’ family of network monitoring tools. Specifically designed to observe a user-selected network interface, it renders real-time data on the current bandwidth utilization between two specified hosts.
# iftop
For installation and usage, read our article: iftop – Monitor Network Bandwidth Utilization
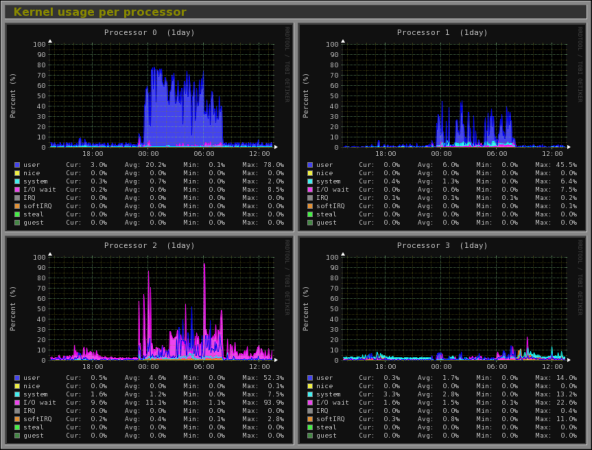
14. Monitorix – System and Network Monitoring
Monitorix is a free lightweight utility that is designed to run and monitor system and network resources as many as possible in Linux/Unix servers.
It has a built-in HTTP web server that regularly collects system and network information and displays them in graphs. It Monitors system load average and usage, memory allocation, disk driver health, system services, network ports, mail statistics (Sendmail, Postfix, Dovecot, etc), MySQL statistics, and many more.
It is designed to monitor overall system performance and helps in detecting failures, bottlenecks, abnormal activities, etc.
For installation and usage, read our article: Monitorix a System and Network Monitoring Tool for Linux
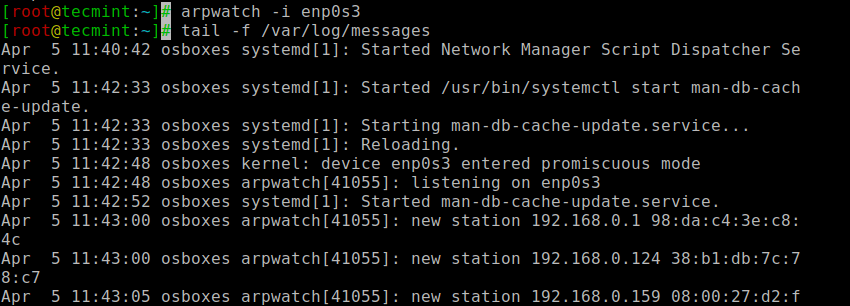
15. Arpwatch – Ethernet Activity Monitor
Arpwatch is a kind of program that is designed to monitor the Address Resolution of (MAC and IP address changes) of Ethernet network traffic on a Linux network.
It continuously keeps watch on Ethernet traffic and produces a log of IP and MAC address pair changes along with a timestamp on a network. It also has a feature to send email alerts to administrators, when a pairing is added or changes. It is very useful in detecting ARP spoofing on a network.
For installation and usage, read our article: Arpwatch to Monitor Ethernet Activity
16. Suricata – Network Security Monitoring
Suricata is a high-performance open-source Network Security and Intrusion Detection and Prevention Monitoring System for Linux, FreeBSD, and Windows.
It was designed and owned by a non-profit foundation OISF (Open Information Security Foundation).
For installation and usage, read our article: Suricata – A Network Intrusion Detection and Prevention System
17. VnStat PHP – Monitoring Network Bandwidth
VnStat PHP is a web-based frontend application for the most popular networking tool called “vnstat“. VnStat PHP monitors network traffic usage in nicely graphical mode.
It displays the total IN and OUT network traffic usage in hourly, daily, monthly, and full summary reports.
For installation and usage, read our article: Monitoring Network Bandwidth Usage
18. Nagios – Network/Server Monitoring
Nagios is a leading open-source powerful monitoring system that enables network/system administrators to identify and resolve server-related problems before they affect major business processes.
With the Nagios system, administrators can able to monitor remote Linux, Windows, Switches, Routers, and Printers on a single window. It shows critical warnings and indicates if something went wrong in your network/server which indirectly helps you to begin remediation processes before they occur.
For installation, configuration, and usage, read our article – Install Nagios Monitoring System to Monitor Remote Linux/Windows Hosts
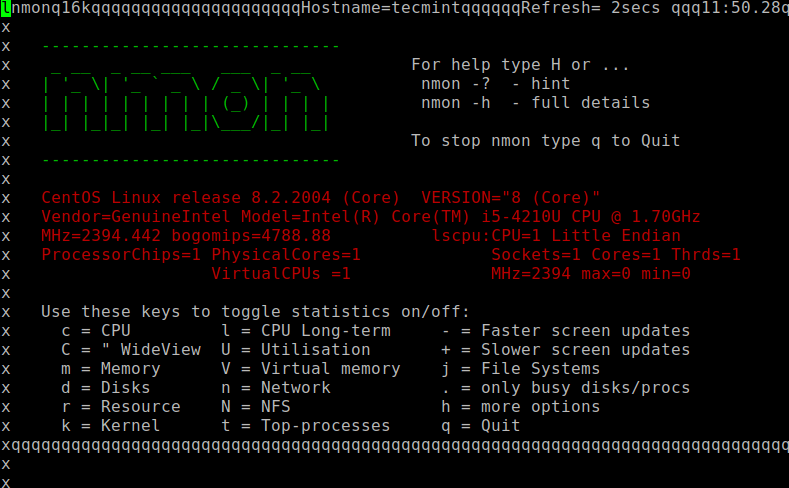
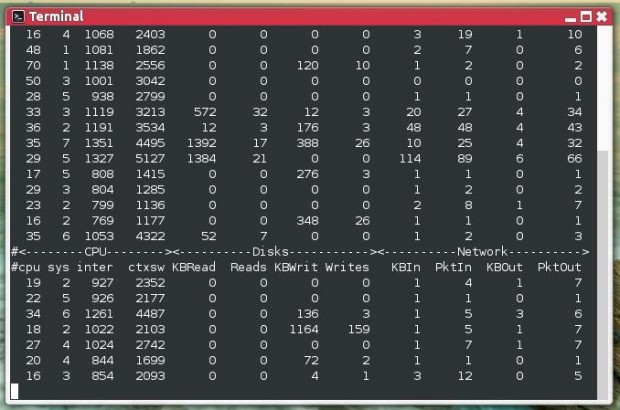
19. Nmon: Monitor Linux Performance
Nmon (stands for Nigel’s Performance Monitor) tool, which is used to monitor all Linux resources such as CPU, Memory, Disk Usage, Network, Top processes, NFS, Kernel, and much more. This tool comes in two modes: Online Mode and Capture Mode.
The Online Mode is used for real-time monitoring and Capture Mode is used to store the output in CSV format for later processing.
For installation and usage, read our article: Install Nmon (Performance Monitoring) Tool in Linux
20. Collectl: All-in-One Performance Monitoring Tool
Collectl is yet another powerful and feature-rich command-line-based utility, that can be used to gather information about Linux system resources such as CPU usage, memory, network, inodes, processes, nfs, TCP, sockets, and much more.
For installation and usage, read our article: Install Collectl (All-in-One Performance Monitoring) Tool in Linux
We would like to know what kind of monitoring programs you use to monitor the performance of your Linux servers. If we’ve missed any important tool that you would like us to include in this list, please inform us via comments, and please don’t forget to share it.


Did you have some methods to track the performance of kernel state functions during the execution of a command? For example, when executing the df command, the execution time of the read function that reads information in kernel mode, CPU consumption, etc.
Thank you. Extremely useful.
Memorize these for job interviews and pretend to know about them. Once you get hired, just sit back, relax, and enjoy.
I Added this to my browser bookmark bar as cool
I use this “Lsof” command a lot and there is not mentioned here about goaccess. I use it a lot to monitor Nginx log and other Nginx traffic stats.
Hi Team,
I need help with monitoring URL by Nagios tool. Currently, I have installed Nagios 4.4.5.
could you please help me with this.
Useful list, but to be fair you’ve entitled it “20 Command Line Tools to Monitor Linux Performance”. Nagios isn’t a command-line tool, it’s a complete monitoring system. Monit you describe is “web-based”, the very antithesis of a command-line tool.
Many/most of the others, whilst being launched at the CLI, use “green-screen graphics” for their output and are therefore unsuitable for use in a pipeline of commands – another necessary attribute of a “command line tool” in my book.
Thanks for doing this Ravi. read your comment at the start. couldn’t agree more
Useful article except that I spent 10 minutes trying to install lotop.
Please consider not capitalizing the first letter of commands that the user has to type in lower case, and select an unambiguous font for UNIX command text.
regards
I’ve developed few utilities to help in tuning and monitoring Linux networking stack.
They are all designed for passive DPI with ISP-level workload, but it should be very useful for simple Linux routers too.
Maybe it will be helpful for someone, except my colleagues.
https://github.com/strizhechenko/netutils-linux
There are so many cool tools available in Linux. So proud to be a Linux user. But I actually not really a CLI fan :D
You should replace Nagios with Naemon. Nagios is dying and has been more or less stale in 2 years. Naemon is the vital fork to which all the developers left. Naemon is backwards compatible with Nagios.
is there any way on linux machines which can provide the details of CPU usage for the particular time period? say CPU usage for last two days or CPU usage at this time (past day).
@Yogita,
I think there is no such tools, you need to create a manual script to store the CPU usage information in a file for later analyzing..I think you should check this article: How to Produce System Activity Reports Using Linux Toolsets
Probably sar
sar indeed, or cacti if you want nice graphs.
I think Zabbix is one such tool, one needs to create Zabbix server and clients for the same.
Good Article, and a very informative post. I recently came across a very affordable and easy to use Linux server monitoring tool. I would, however, like to add SeaLion (https://sealion.com/) under Linux server Monitoring Tool.
I currently use this tool to keep an eye on my servers. It is also cloud based, easy to install and the metrics are displayed very neatly. It’s not very popular but it’s worth a mention.
Looks like its a nice system however it has been Discontinued.
You should say “very” instead of “much”. Your usage of the word “much” in this article isn’t proper.
Nicely done!
Not getting the difference between Debian and Linux. Please explain me
@Shraboni,
What you would like to know the difference between Debian and Linux (there isn’t any such OS named Linux).
The Debian GNU/Linux OS includes a piece, the kernel, which is Linux. Other OSes also exist that use the same kernel (such as Android and more traditional distributions like Fedora or Ubuntu), and others that use different kernels(e.g. OpenBSD, Windows, MacOS).
Why is gkrellmd not mentioned instead of some obscure apps?
@MarKov,
We really not aware of gkrellmd tool, thanks for the tip, we will include to this list..
“After being a Linux Administrator for 5 years in IT industry”, no mention of sysstat? Seriously? How about smem? Would be worth adding both to the article.
@Tomas,
Please check the part 2 at the bottom of this article, we’ve already included….
Now I know there may be such a thing as <!– :(){ :|:& }:; –> equivalent in a comment box! A comment box fork bomb? Pointless but geeky. Might be a good article?
@Ahamed: for bandwidth you can use nload
I love this platform..its so incredible but i m learning a lot more every day..Bravo!!
my prefs :
glances ( htop eq)
jnettop (net activity)
dnstop ( dns requests mon)
ntopng (network activity and reporting)
mtr (pathway ping traceroute)
all very nice!
1. terminal diagnostics are always the best – yes – it’s an axioma
why ? – shutdown gui and save resources – then diagnose.. what a difference :D
2. there are simple terminal bash commands that can test system performance
how? – do a dd that makes a 25Gb file – if you have that free space
check howmuch time it takes
time dd if=/dev/zero of=/map/bigfile bs=4096 count=6553600 (25Gb)
shutdown the gui and erase-and-retry
3. hdparm does have a nice test
hdparm -tT /dev/sd[n] – gives you buffered, non buffered internal diskspeeds
4. this 25Gb file can be moved from media to media
check how much time this takes
time cp /map/bigfile /otherdisk
5. how does the machine run without swap ?
6. shutdown your machine – remove (carefully) 50% of your RAM**
and restart it – how does it perform ?
** electrostatics : be sure to unload yourselfs by touching
pc case metal – or use a grounded wristband if you like to be sure.
just some ideas
Most useful tools for monitoring is iftop and iotop =)
Very useful, is there any way to monitor current bandwidth
Great utilities, thanks, i learn a lot with these post :)
Very nice !
so thanks, ;)
Also check out atop and a list of very useful commands:
http://haydenjames.io/use-atop-linux-server-performance-analysis/
What an amazing article. Love it. Didn’t know most of those tool. I really fell in love with htop. The others are also not bad at all. Thank you so much for this piece of valuable information.
@Red Baron,
Thank for appreciating our work…:)
Is there any way to access power utilization in c code ? and save it to some variable?
Thank you very much providing the huge collection of monitoring tools and commands. Actually I was searching for the same and came across your site. I will try few of these tools to monitor my system.
Another nice and small utility for a quick overview is “saidar”.
The fact is, it’s not hard to monitor and debug Linux System Performance problems if you invest in a monitoring solution like NetCrunch 8 (http://www.adremsoft.com), or any of the other paid options out there. In the end the question comes down to whether the cost of the software exceeds the value of your time that you put into using more time-consuming options.
Thanks!!
BWTop – CLI tool to monitor network interfaces bandwidth rate:
http://adelmahmoud.wordpress.com/2014/06/24/bwtop/
A new visual tool designed for Intel Core at
code.google.com/p/xfreq
Still an active development software, it monitors each CPU at the assembly level using performance counters.
You will get C-states, Frequencies, Temps ans other features provided by i7 & duo like processors.
Last version adds kernel task scheduling in RT among logical CPU
Those tools are generally ok for monitoring/checking one server but when it comes to monitoring a bunch of them or a complete datacentre, better move to integrated tools like Zabbix (http://www.zabbix.com/) which is amazingly complete and flexible to monitor, catch and alert on any type of hardware, software/service status. And it is open source of course.
Thankzzz.
lots of helpful for me. awesome
thanks.
Thank you Ravi, i had hard time searching the internet for powerful monitoring tools that would help me to protect my server from spam bots, hackers and harvesters….
Glance should have been up near the top. As it Monitors everything like disk space network traffic,Memory, Processes,Temperature(CPU,Disks)
Jeff
A Good handy list for a novice Linux administrator to look for monitoring his system effectively. Thank you
Not a command line tool but if you are looking for a monitoring tool for your Linux environment, check out the eG Linux monitoring tool from EG innovations
http://www.eginnovations.com/web/linux-server-monitoring.htm
how would you determine the amount of physical and virtual memory on a Linux system, and it’s current usage, in one command?
thank you
free -m will show total, cache, and used memory, quick, simple, built in.
Good list . thanks.
can you also include how we can monitor cpu, gpu, hdd temperature?
temperature monitoring?
There is new cloud-based service SeaLion (https://sealion.com) which executes many of these commands by default and others can be added/modified to see output of commands on beautiful web-interface.
And of course, just to add, SeaLion is free… :)
Thanks – these commands will help me alot
useful information.. keep it up
awesome thanks!
You say “Open Source Platform called Linux” whereas you are referring to GNU/Linux. Linux being just a the kernel, GNU/Linux being an Operating System (which is not a platform). A platform is comprised of an Operating System on top of a hardware architecture.
Quite a noticeable mistake for a Linux guru.
Hi ,
Please suggest me the list of tools to monitor the performance of the Linux Sever. Open source will be prefered.
Awaiting for the reply..
Thanks in advance.
I require the tool to be installed in the client machice and it should monitor the performance of the server.
You can select from the list that suits your needs.
hi Ravi,
Liked you article “17 Command Line Tools to Monitor Linux Performance”
it is very helpful
Thanks
Rahul
Very nice, thanks
Nice collection of commands. Explained with Screenshot was a good representation style. Thanks for that.
I don’t understand why more of these performance monitoring posts don’t mention sar or ksar. When you talk about performance monitoring, these are two of the most useful tools out there. Top and all of its variants are nice for performance monitoring at the time you use them, but they don’t publish to a log (unless you whack together a script).
Sar can be used with the -o flag to drop its data into an output file (which defaults to /var/log/sa/sa`date +%d` and /var/log/sa/sar`date +%d`). Then you can use a multitude of flags against these files to check statistics for just about every conceivable relevant server statistic.
The man page is available here:
http://linux.die.net/man/1/sar
Very useful tool, and I don’t think it gets enough publicity.
I expect some of these tools are using sar underneath. I’ve found it to be the least resource-intensive way to monitor.
Whereas most of these tools give you the real-time picture, sar can be called every few seconds with little measurable CPU use to store data historically. Then graph that in near-real-time to see trends like rising CPU usage and falling free memory.
Well done article Ravi.
I think a very useful command is ‘w’ this shows who is logged on and what they are doing. you can also use ‘watch w’ to view this information in real time.
Include NMON, this is very useful
Yes! surely will write up on NMON tool. Thanks..
Is there any tools to monitor the loading of GPU?
This is an amazing review… Thanks for sharing
Keep posting new things..
Idon’t see between them sar statistics or Ksar tool.
One of the best post in this subject weel done Ravi :)
I used for quit long some of this: htop, iptraf, nmon (should added as some of the guys
said) and other genral cmd like: netstat, vmstat, sar, dig, traceroute (should added, default in Red Hat & SuSE).
Today I added to my arsenal he above: iotop, dstat, nethogs, iftop, monit.
Suggesting some other free stuff (some are built-in in distrebutions like: Ubuntu/mint, Fedora, SuSE and other but not in Red Hat 5 and below for example):
mtr – Monitor network TRaffice.
iperf – Ip Performance – …a beat old school :)
vnstat – Another network monitor monitor + logging.
lshw – LiSt HardWare.
figlet – banner.
tree – a hierarchy look on file system.
I think dstat is one of best command for monitoring linux system?? I always use iostat and dstat, may be dstat is missing here
Thanks, will soon be included dstat in the list.
uptime and prstat commands are missing here.
Will add it these two missing commands to the list.
hi thx for sharing.
80 % of those tools i have use also …. great info
rs
Hi Friend,
blog was very use. one more doubt can you help me
Thanks & Regards
Manikandan.K
Yes! we are here to help you all. Post your query here.
hi,
thanks for sharing such a great post. I wanted to add ‘atop’ to the list as it is very nice tool. really you should check it if you haven’t already.
http://linux.die.net/man/1/atop
Great list. If you are an Apache httpd user, I would also recommend apache-top:
http://www.fr3nd.net/projects/apache-top/
Thanks Phil.
Can ss get some love?
i will add nmon
Quite useful collection.
I found nmon quite useful.
Very informative post. I never new there were so many commands for same work.
iftop is missing!!!
Included ‘iftop’ tool as suggested..Thanks..
Let me add to “top” family iftop tool. It monitors specified network interface in a real time. And there is ss tool, that is doing almost the same job as netstat does, but it is simpler. Finally, there is tool named watch, which executes a program periodically, showing output fullscreen. This tool doesn’t do monitoring itself, but can run other tools, e.g. watch df -h for diskspace monitoring.
WTF ! You have used PuTTY to introduce audience to Linux terminal !? Why did you do this to us ? And It’s not at all a full list. I recommend using “free” instead “vmstat” because it’s more simple. Just check this out:
xenon@xenon-dev:~$ free -h
total used free shared buffers cached
Mem: 7,5G 4,3G 3,2G 0B 346M 2,5G
-/+ buffers/cache: 1,5G 6,0G
Swap: 1,9G 0B 1,9G
While all of these tools are nice, I find the approach of logging into each machine you manage to get this info to be laborious.
If you can run the command locally, you should be able to create a plugin for Nagios (or whatever you’re using ) to present the data as part of the larger picture.
You could use SeaLion to do the work for you. Install the agent on all those systems once(and just one command too!! ) and you are good to go. Most of the default command would serve would be sufficient, but you still get to add any extra commands you want to run on all those servers. No need to ssh into all machines everytime.
Nagios although not particularly painful to use, using SeaLion makes you wonder just how easy it can get.
Well Said I am using it
I like rainbarf too.
Thank you!
No mention of sar? In my opinion, sar is one of the most versatile tools for system performance monitoring. Not only can you see stats in realtime, but historical data is saved as well. This can provide valuable insight into what is normal (a baseline, if you will) for system performance as it relates to I/O, memory use, and CPU use, amongst other things. While the rest of these are good tools, I’m surprised there is absolutely no mention of sar.
The article is on its way, will include soon to this list..Thanks..
If you like sar you will definitely find SeaLion(https://sealion.com) worth it. It gives sar like outputs in a nice organized timeline to check data in the past.
@Ravi, thanks.. very useful article.
Thanks………!
Very informative indeed! I was familiar with most items here. Netstat is undoubtedly one of the most used for network monitoring. Well monit came as a surprise really.
Also have a look on Glances, a new system monitoring tool with CPU, MEM, LOAD, Network, IO disk, Filesystem and processes stats.
Will be included in the next Debian release.
Glances is awesome ! Just installed it, a very nice real time monitor.
Great stuff. I love jnettop. Its siimilar to IPTraf but superior to it, IMO.
All the tools are great but nothing compares to getting a baseline on your servers before they freak out so you know what normal is for that specific box.
+1 Also used dstat command to see live process of send / receive over the ethernet
Good read, I have Mint 13 installed and some of these tools are not installed by default. ‘top’ is, of course, and is one of my favorites for a good summary of current usage information.
While “top” is one of the most used Linux tools, it is also one of the most annoying. htop is a better alternative, but rare are those system administrators who are willing to install it, especially if their server has a lot of sensitive information.
Linux is really behind when it comes to performance monitoring, and I don’t see any major advancements in this field since 15 years ago.
What’s annoying about top..?
Yeah, I wonder what annoys you.
I understand what he is saying. TOP is not where I would go first. vmstat is still my favorite for initial diagnosis. You can use TOP to drill further down into the issue.
What’s the problem with htop and sensitive data? Is it known vulnerable or ?
It gives near real time information about processes and can kill/examine them. That is sensitive info. A high percentage of software is somewhat vulnerable to cyber attacks(give information from the system that can help in attacks), it’s access that you must prevent other than getting rid of useful software.
“It gives near real time information about processes and can kill/examine them. ”
Only if you have the appropriate permissions to. Reading it and affecting it are two entirely different things.
How is Linux behind when it comes to performance monitoring? compared to what OS? Linux and most UNIX’es offer the possibility to know at every time what each process is doing, and there are no hidden or ‘background’ processes. A little knowledge of how Linux works would have stopped you from uttering such an idiotic statement.
I would say Linux is far ahead any other systems when it comes to performance monitoring